Figures & data
Table 1 Characteristics of Patients with AR and Healthy Individuals
Table 2 The Basic Information and HWE About the Candidate SNPs of PLCL1
Table 3 Genetic Variants in PLCL1 Associated with Susceptibility of AR
Table 4 Genetic Variants in PLCL1 Associated with Susceptibility of AR in the Subgroup Analysis (Age and Gender)
Table 5 Genetic Variants in PLCL1 Associated with Susceptibility of AR in the Subgroup Analysis (BMI and Region)
Table 6 PLCL1 SNP-SNP Interaction Models Analyzed by the MDR Method
Figure 1 Multifactor dimensionality reduction (MDR) analysis of interaction between the candidate genetic loci of PLCL1 (rs2139049, rs6738825, rs2164068, and rs2228135). The color represents the degree of redundancy or synergy between SNP-SNP; the closer the color is to red, the more synergy, and the closer to blue, the more redundancy.
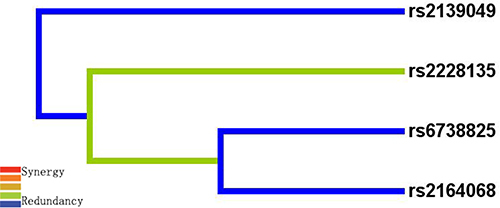
Table 7 Haplotype Analysis of Candidate PLCL1 Genetic Polymorphisms with AR Risk
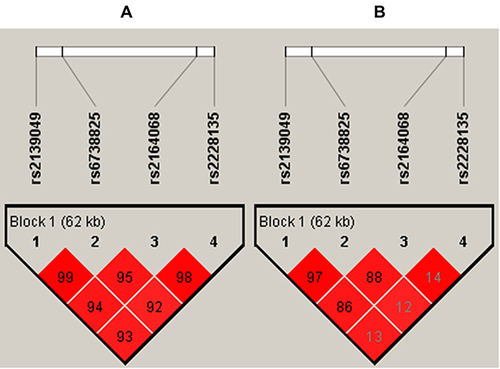
Figure 2 Haplotype block map for the PLCL1 genetic loci (rs2139049, rs6738825, rs2164068, and rs2228135). (A) The numbers inside the diamonds indicate the D’ for pairwise analyses. (B) The numbers inside the diamonds indicate the r2 for pairwise analyses. The colors represent the degree of linkage disequilibrium: the redder the color, the stronger the linkage disequilibrium.