Figures & data
Table 1 Socio-Demographics of Allergic Patients and Controls
Table 2 Characteristics of Different Groups of Allergic Patients and Controls
Table 3 Allelic and Genotypic Frequency for IL13 rs20541 Gene Polymorphism Among Different Patient Groups and Controls
Figure 1 Allelic discrimination plot showing the results of IL13 rs20541 SNP genotyping by real-time PCR in 48 examined allergic patients. Blue dots correspond to the homozygous GG genotype (28 patients), green dots correspond to the heterozygous AG genotypes (17 patients), and red dots correspond to the homozygous AA genotype (3 patients). The X-axis represents the fluorescence of allele A while the Y-axis represents that of allele G. Different colors correspond to different fluorescent dyes used in the reaction; FAM (blue), ROX (red), and VIC (green).
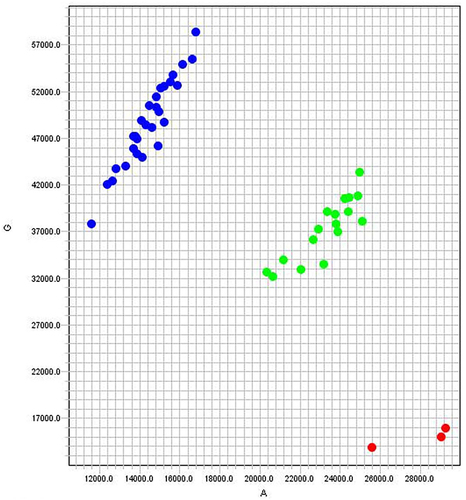
Table 4 Serum Levels of Periostin and IL13 Among Different Groups of Patients and Control
Table 5 Relation Between Serum Periostin, Serum IL13, and IL13 rs20541 Alleles and Genotypes Among Allergic Patients (n = 81)
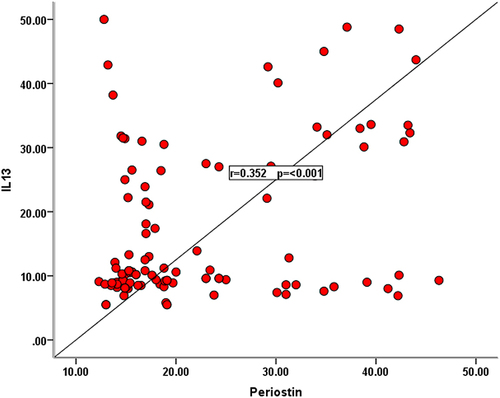
Figure 2 A scattered plot curve shows a significant positive correlation (r=0.352, p<0.001) between serum level of periostin and serum level of IL13 among the examined allergic patients (n=81).