Figures & data
Figure 1 The interaction of pollutants such as PM2.5 and O3 with pollen induces: (A) an increase in the production of pollen concentrations, (B) a fragile pollen membrane, and (C) post-translational modifications in the allergenic protein. In all cases, there are increased levels of allergen proteins, which can be processed by antigen-presenting cells, resulting in a type I hypersensitivity inflammation (mechanism mediated by IL-4, IL-5, and IL-13, and an increase in immunoglobulin E), whose main objective is the degranulation of preformed mediators (histamine or tryptase) contained in mast cells, which promotes mucus secretion by goblet cells and bronchospasm, main symptom of asthma.
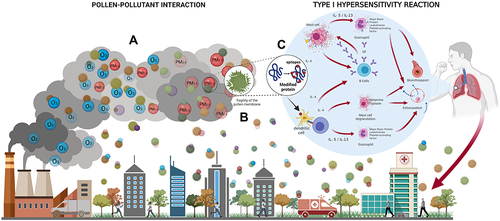
Figure 2 Distribution of allergy sensitivity. (A) Venn diagram of patients sensitive to only one allergen (monosensitive) and patients sensitive to two or more (polysensitive), (B) Venn diagram of patients sensitive to indoor allergens and/or pollen, (C) Venn diagram of patients sensitive to and/or different of pollen (trees and/or grasses and/ or weeds).
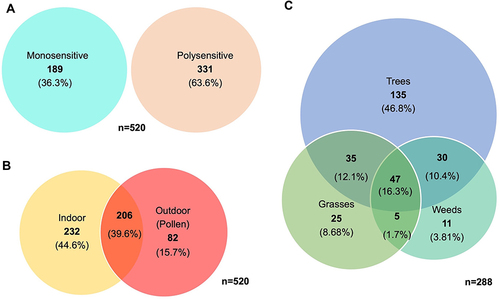
Figure 3 The main sensitization to aeroallergens in skin prick test.
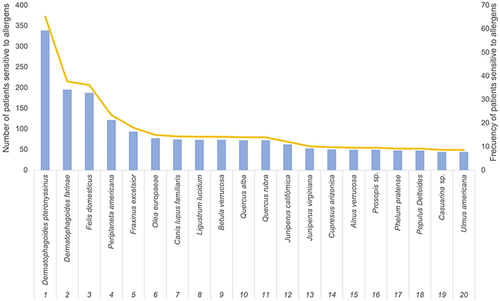
Figure 4 Allergic sensitivity by disease.
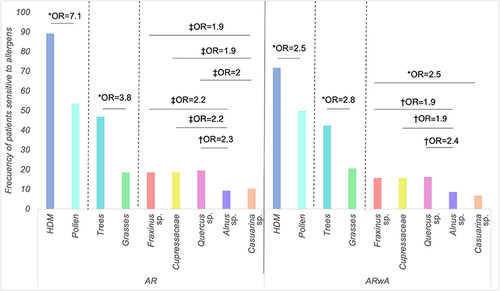
Table 1 Seasons Comparison
Figure 5 Pollen monitoring (2014–2018). (A) Pollen frequency, (B) Pollen count measured in annual pollen Integral (APIn), (C) Pollen counts by pollination season.
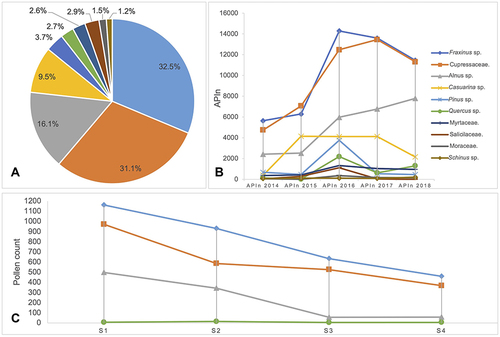
Figure 6 Allergic sensitivity per period by disease.
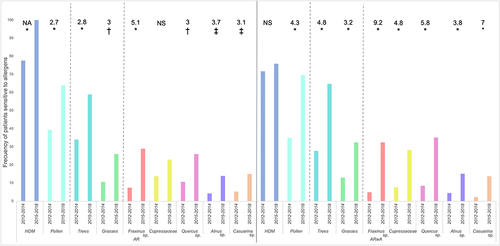
Table 2 Meteorological and Pollutants Analysis Between Pollination and No Pollination Seasons
Table 3 Global Correlations Between Meteorological Variables and Pollution with Pollen
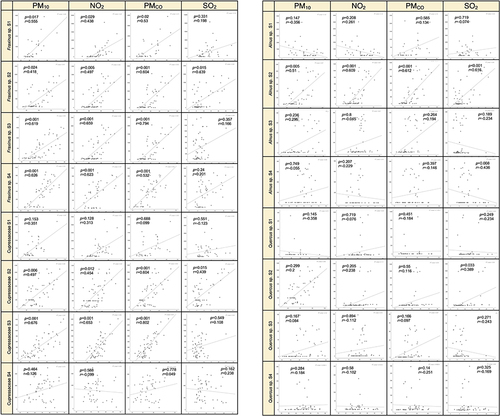
Figure 7 Seasons correlations between significant meteorological variables and pollutants with pollen.