Figures & data
Figure 1 (A) Experimental group subject disposition. (B) Experimental group study design.
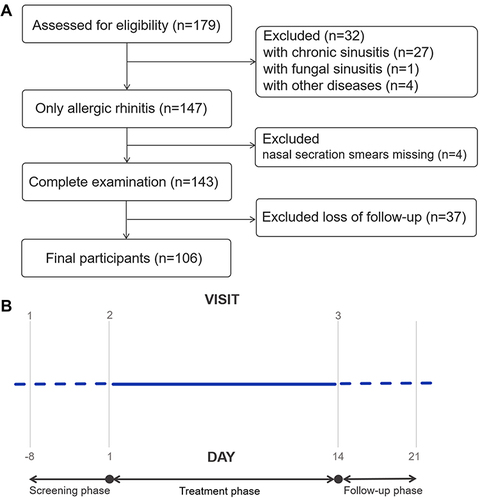
Figure 2 (A) Schematic diagram of the principle of the eosinophil cationic protein-myeloperoxidase (ECP-MPO) test paper. (B) Test paper operation steps: a. Take out the sample extract, test card, and sampling strip; b. allow the nasal secretions to infiltrate the scribe line of the sampling strip; c. cut the soaked sampling strip into the ECP extract (green) and MPO extract (yellow) strips along the scribe line; d. shake the bottles with the extracts for 15 seconds; e and f. Put two drops of the extracts from the green bottle and the yellow bottle on the ECP and MPO test holes respectively, and wait for 10 minutes; after the incubation time, read the results. (C) Test paper result display. a. normal; b. allergic inflammation; c. infectious inflammation; d. infectious inflammation or infectious inflammation combined with allergic inflammation.
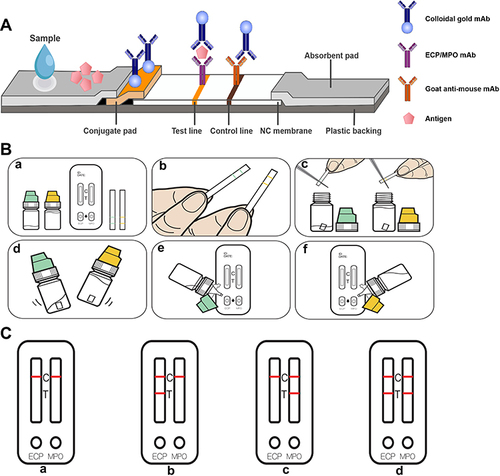
Figure 3 (A) Colour grading of the ECP-MPO test paper and test paper performance in samples from healthy control subjects. (B) Comparison of the eosinophil cationic protein-myeloperoxidase (ECP-MPO) test paper results before and after drug treatment. (C) Microscopic examination of nasal secretions. a. The morphology of eosinophils observed using oil-immersion microscopy; b. eosinophils from level 3 participants (400X); c. eosinophils from level 2 participants (400X); d. eosinophils from level 1 participants (400X); e. eosinophils from control participants (400X). (D) Correlation between the colour grade of the test paper and the percentage of eosinophils before and after treatment. (E) Correlation between the colour grade of the test paper and the ECP concentrations in nasal secretions before and after treatment. r1, correlation coefficient before treatment; r2, correlation coefficient after treatment. (F) Receiver operating curve (ROC) of ECP-MPO test paper. (G) The levels of color grading from all patients before and after treatment and control subjects. (H) Paired t-test of color grading level of ECP test paper before and after treatment in patient group. (I) a. Comparison of serum total IgE (IU/mL) and sIgE (IU/mL) in produced response to Der p and Der f between control participants and allergic rhinitis (AR) participants; b. comparison of serum eosinophil cationic protein (ECP) concentration (μg/mL) and the proportion of eosinophils under 400X magnification (light microscopy) between control participants and participants with AR before and after drug treatment; c. comparison of the total nasal symptom score (TNSS), quality of life questionnaire (RQLQ), and visual analogue scale (VAS) scores between the control group and the experimental group (with AR) before and after drug treatment. *, P<0.05; **, P<0.01.
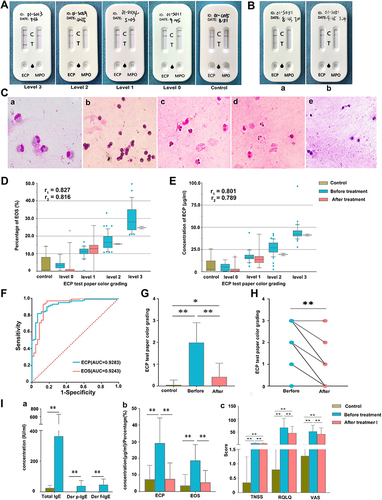
Table 1 Baseline Characteristics by Gender
Figure 4 (A) a. Sensitivity of ECP-MPO test paper diagnosis; b. Specificity of ECP-MPO test paper diagnosis. (B) Kappa test of positive test paper results and total IgE, Der p-IgE, Der f-IgE and SPT. (C) correlation between the concentration of ECP in nasal secretions and the concentration of total IgE, and IgE pertaining to Der p and Der f. (D) Correlation between ECP concentrations in nasal secretions and TNSS, RQLQ, and VAS scores before and after treatment; r1, correlation coefficient before treatment, r2, correlation coefficient after treatment.
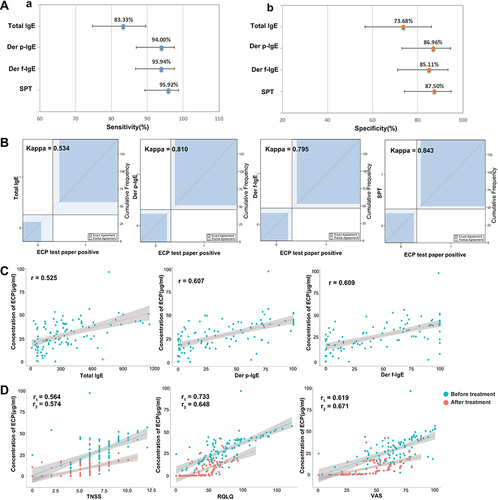
Figure 5 (A–C) Correlation between the colour grade of the eosinophil cationic protein-myeloperoxidase (ECP-MPO) test paper and total IgE, Der p-IgE and Der f-IgE levels. (D–F) Correlation between the colour grading of the ECP-MPO test paper before and after treatment and the total nasal symptom score (TNSS), quality of life questionnaire (RQLQ), and visual analogue scale (VAS) scores. r1, correlation coefficient before treatment; r2, correlation coefficient after treatment.
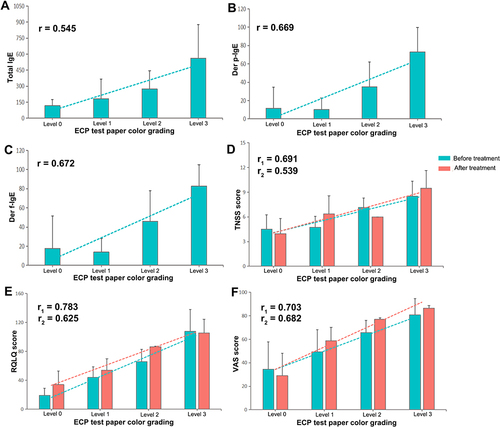
Figure 6 (A) Serum interleukin (IL)-6, IL-10, tumour necrosis factor (TNF)-α, IL-4, IL-17A, interferon (IFN)-γ and IL-2 concentrations (pg/mL) of control participants and participants with allergic rhinitis (AR) before and after treatment. (B) The correlation coefficient between the colour grading of the eosinophil cationic protein-myeloperoxidase (ECP-MPO) test paper and the concentration of serum IL-2, IFN-γ, TNF-α, IL-17A, IL-10, IL-4, and IL-6. (C) Serum C-C motif chemokine ligand (CCL) 11 (pg/mL), CCL17 (×10−1 pg/mL), CCL22 (pg/mL), and CCL26 (×10−2 pg/mL) levels of control participants and participants with AR before and after treatment. (D) The correlation between the colour grading of the ECP-MPO test paper and the serum concentrations of CCL26, CCL22, CCL17, and CCL11.
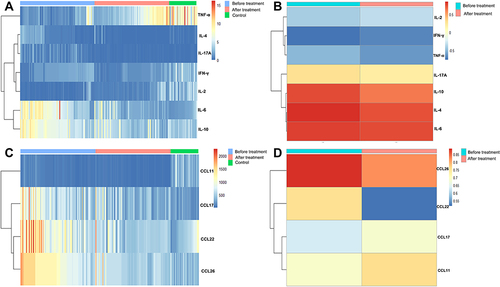
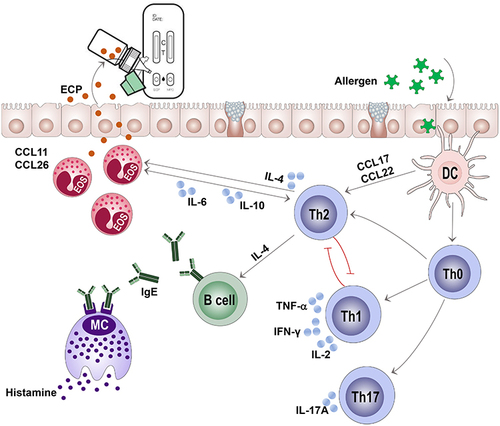
Figure 7 Schematic diagram of the association between eosinophil cationic protein (ECP) and cytokines and chemokine.