Figures & data
Table 1 Criteria for Clinical Evaluation of Allergic Ocular Findings
Figure 1 Percentage of IFN-γ-producing CD4+ T cells in PBMC. The results are expressed in percent as mean ± SEM (*P < 0.05).
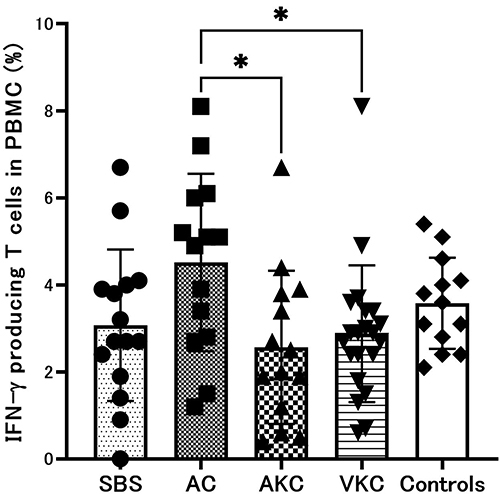
Figure 2 Percentage of IL-4-producing CD4+ T cells in PBMC. The results are expressed in percent as mean ± SEM (***P < 0.001).
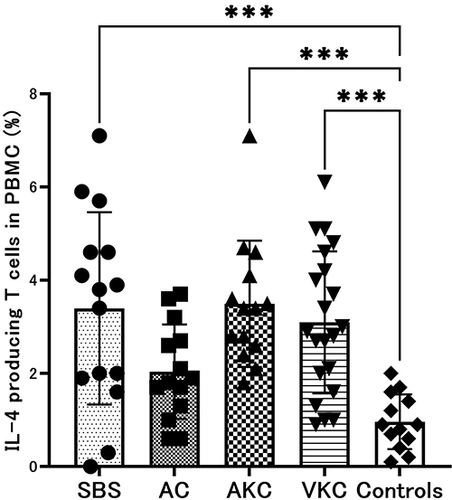
Figure 3 Percentage of IFN-γ-producing CD4+ T cells in conjunctiva. The results are expressed in percent as mean ± SEM (*P < 0.05; **P < 0.01; ***P < 0.001).
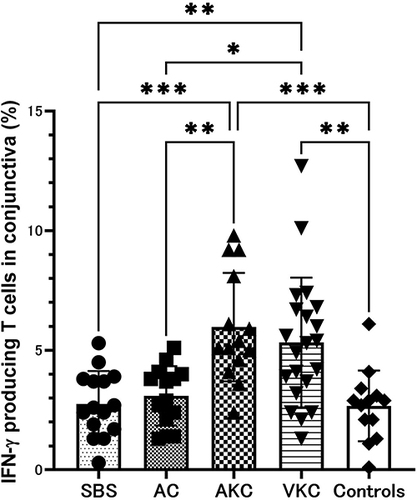
Figure 4 Percentage of IL-4-producing CD4+ T cells in conjunctiva. The results are expressed in percent as mean ± SEM (**P < 0.01; ***P < 0.001; ****P<0.0001).
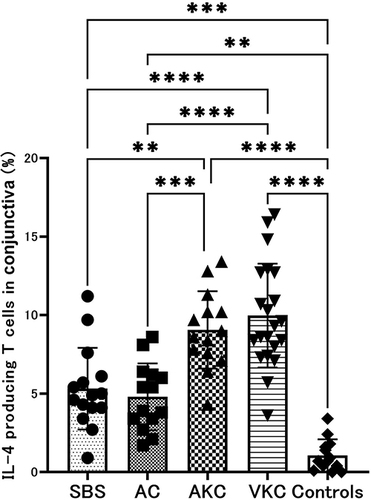
Table 2 Correlation Between Percentage of IFN-γ- or IL-4-Producing CD4+ T Cells in PBMC or Conjunctiva and Clinical Score in Patients with SBS
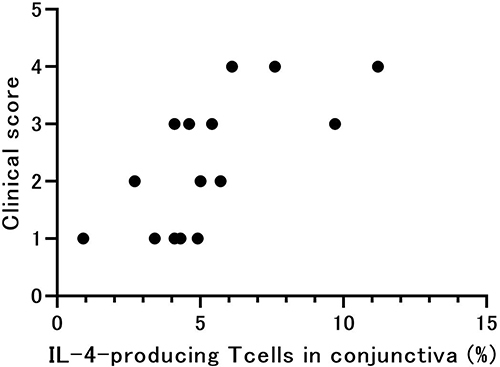
Figure 5 Correlation between percentage of IL-4-producing CD4+ T cells in conjunctiva and clinical score in patients with SBS. Correlation coefficient between percentage of IL-4-producing CD4+ T cells in conjunctiva and clinical score was significant (P = 0.0025, Spearman’s rank test).