Figures & data
Figure 1 A schematic overview of the study.
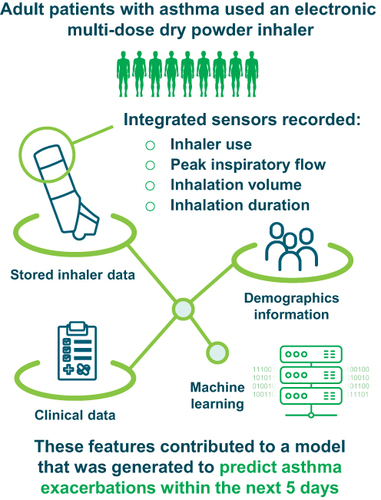
Figure 2 A patient example showing prediction periods and confirmed exacerbation in relation to albuterol use between study days 55 and 85, and albuterol use, peak inspiratory flow, and inhalation volume for the same patient over the full study period. Patient was a male (43 years of age) with a body mass index of 31.9 kg/m2. The red vertical dashed line represents a confirmed exacerbation.
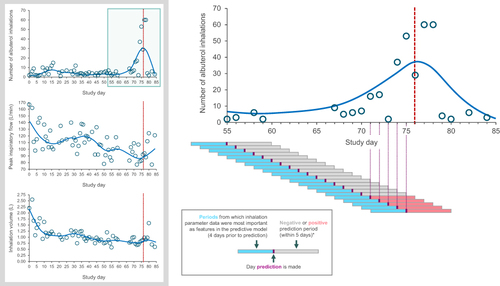
Figure 3 Patient disposition.
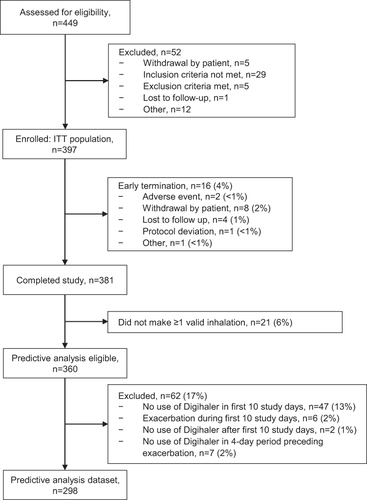
Table 1 Baseline Demographics and Maintenance Medication Use
Table 2 Inhalation Parameters and Albuterol Use Over the Full Study Period Captured by the Digihaler in Patients Who Completed the Study with ≥1 valid Inhalation
Figure 4 Albuterol use preceding a patient’s first asthma exacerbation during the study. Data are shown for patients who completed the study and made ≥1 valid inhalation from the Digihaler. The vertical dotted line represents a confirmed exacerbation.
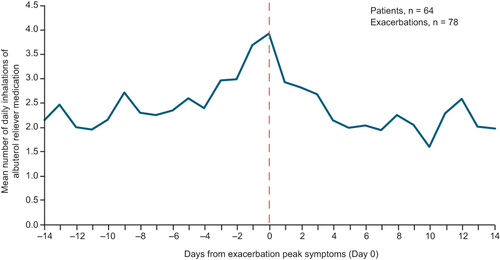
Figure 5 Percentage change from baseline in peak inspiratory flow and inhalation volume during ± 7-day window around an exacerbation, compared with the daily mean outside of this exacerbation window, in 52 patients with one exacerbation. Data are shown for patients who completed the study with ≥1 valid inhalation from the Digihaler, experienced one exacerbation, and made ≥1 valid inhalation outside of the ± 7-day window around the exacerbation. The vertical dotted line represents a confirmed exacerbation.
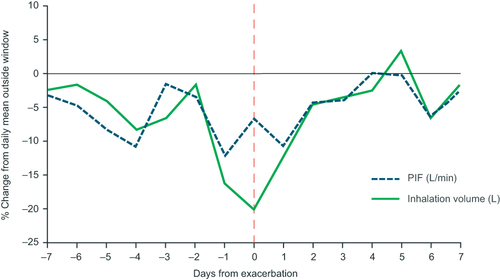
Figure 6 Receiver operating characteristic curve of sensitivity and specificity of a model for predicting upcoming exacerbations within 5 days. Selected risk percentiles shown in table are based on model score, eg, the sensitivity and specificity values for risk percentile 1 are those for the 1% of data points with the highest predicted probability for an exacerbation within 5 days.
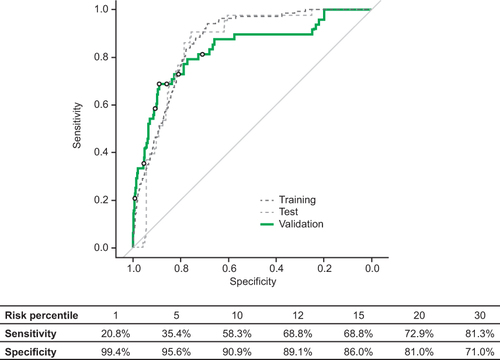
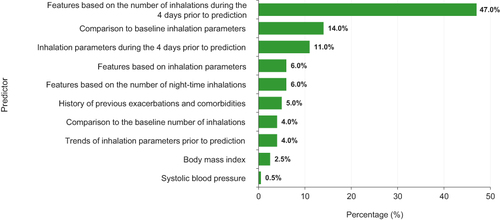
Figure 7 Features contributing to predictive model performance. The 4 days prior to prediction refers to the 4 days before the prediction was made and not the days prior to an exacerbation. For the predictive model, baseline features (number of inhalations and inhalation parameters) were those measured during the first 10 days of the study. Features shown are those that were found to contribute to the model performance. Other features were also input to the model but were not found to contribute.