
Figures & data
Figure 1 Study design. Index date: latest date of the eosinophil count assessed at least 1 year prior to the last visit. Baseline period: 1 year before the index date. Follow-up period: 1 year after the index date.
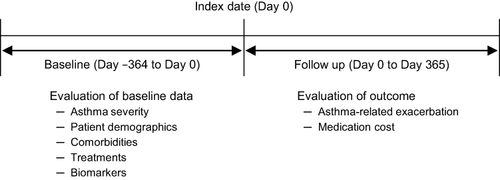
Figure 2 Analysis population.
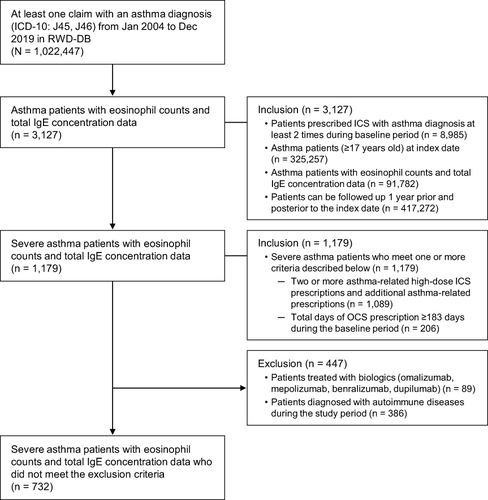
Figure 3 Proportion of severe asthma patients classified by eosinophil counts and total IgE.
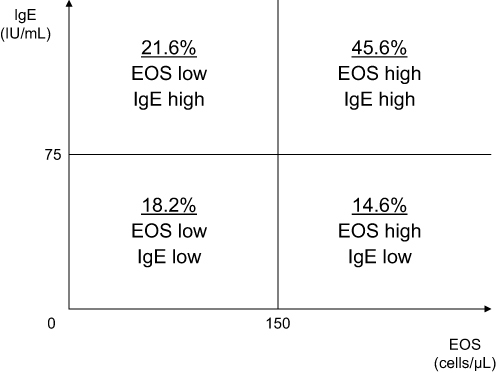
Table 1 Patients’ Demographics and Baseline Characteristics in T2-High and T2-Low Populations
Table 2 Asthma-Related Exacerbation Events and Medicine Cost During the Follow-Up Period in the T2-High and T2-Low Populations
Figure 4 Proportion of patients with asthma exacerbation in the T2-high population and T2-low population.
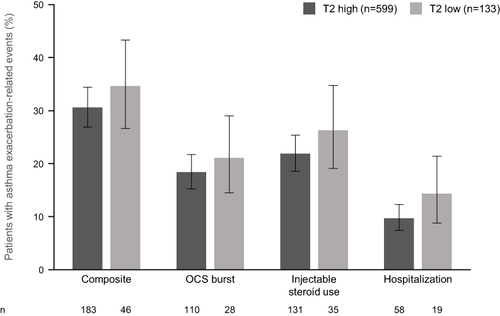
Table 3 Asthma-Related Exacerbation Events and Medicine Cost During the Follow-Up Period in the T2-High Subpopulation
Table 4 Proportions of Patients and Asthma-Related Exacerbation Events During the Follow-Up Period in T2-High and T2-Low Populations Stratified by Different T2 Criteria