Figures & data
Figure 1 Study flowchart.
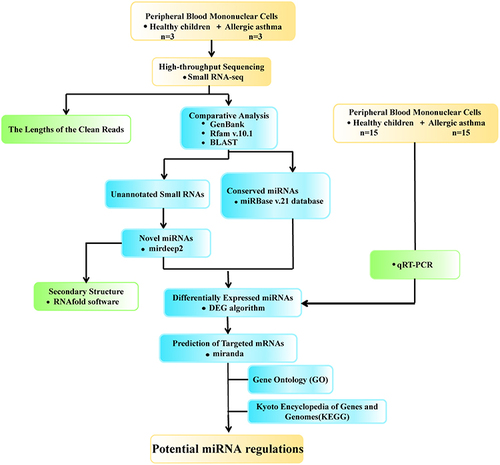
Table 1 Summary Characteristics of Allergic Asthma Patients and Controls
Figure 2 Length distribution and abundance of the small RNA sequences.
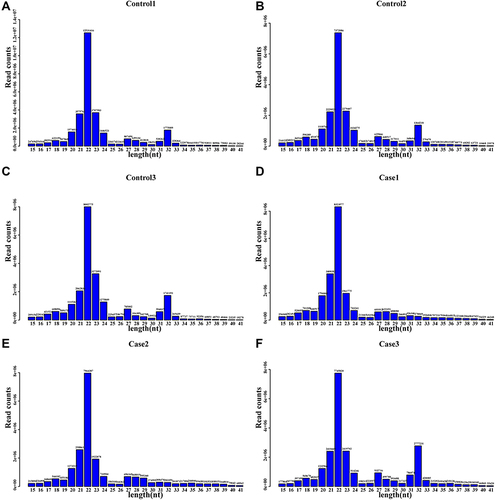
Figure 3 The category annotation of the six libraries: (A)–(C) Healthy children and (D)–(F) Allergic asthma.
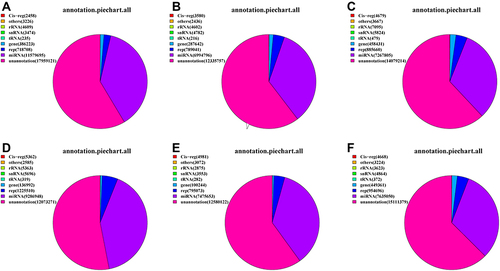
Figure 4 Base bias and length confirmation of known miRNAs.
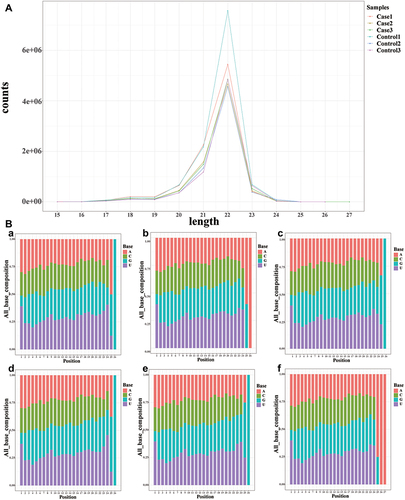
Table 2 Top 50 of Differentially Expressed miRNAs Between Allergic Asthma and Healthy Controls
Figure 5 Differential expression and characteristics of miRNAs between allergic asthma and healthy controls.
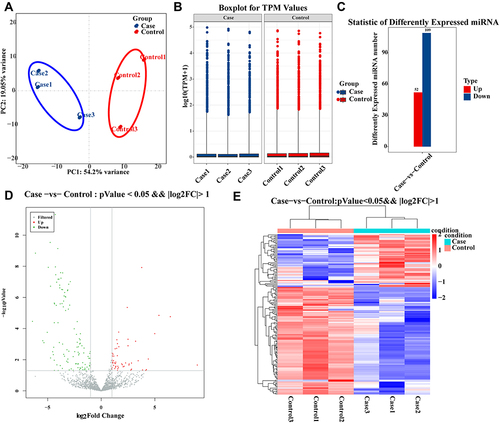
Figure 6 Secondary structures of the top 10 novel miRNAs.
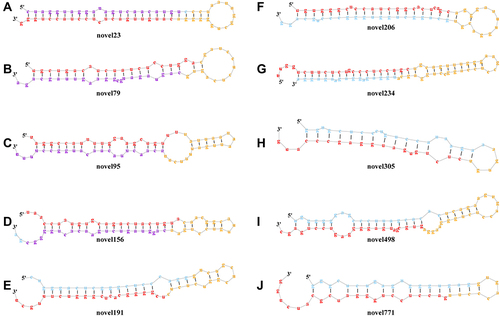
Figure 7 KEGG pathway enrichment analysis and Gene Ontology (GO) classification for targeted mRNAs of differentially expressed miRNAs.
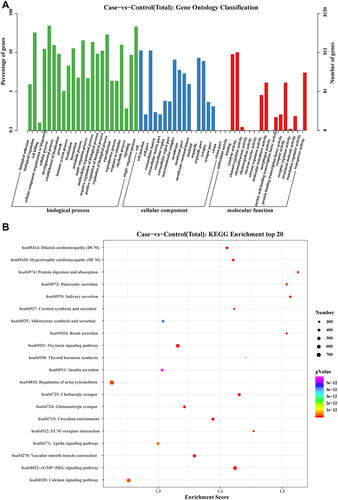
Table 3 Statistics of KEGG Enrichment Top 20
Figure 8 The network of differentially expressed miRNAs-mRNAs in the cGMP-PKG signalling pathway.
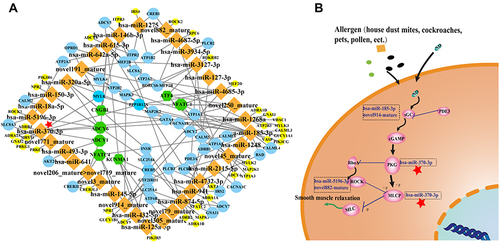
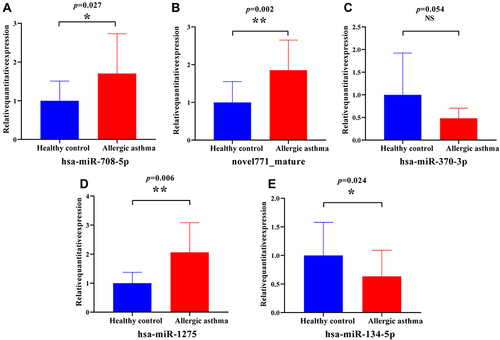
Figure 9 Expression analysis of selected candidate miRNAs assessed by qRT-PCR between allergic asthma (n = 15) and healthy controls (n = 15).