
Figures & data
Figure 1 Study flow.
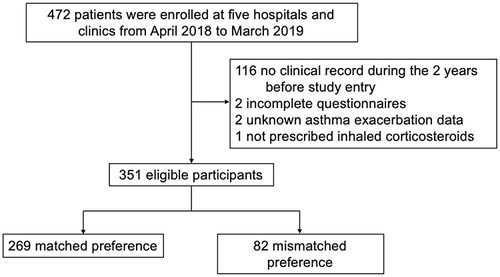
Figure 2 Definition of patient preference for inhalers.
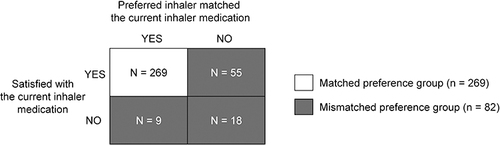
Table 1 Patient Characteristics
Figure 3 Comparison of (A) prevalence of uncontrolled asthma and (B) exacerbation rate between patients of matched and mismatched groups. Error bars represent (A) 95% score confidence intervals and (B) 95% confidence intervals. *P<0.05.
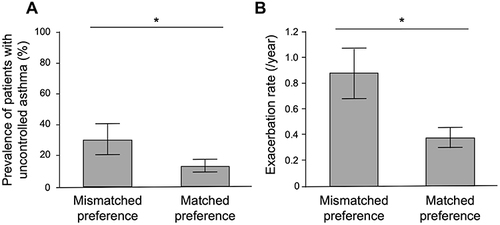
Table 2 Univariate and Multivariate Linear and Logistic Regression Analyses for Uncontrolled Asthma, Exacerbation Rate, and Adherence
Table 3 Univariate and Multivariate Logistic Regression Analyses for Regular Oral Corticosteroid
Table 4 Comparison of Patient Characteristics Between Matched and Unmatched Groups Regarding DPI or pMDI Usage