Figures & data
Table 1 Brief Summary of the Data Collection Across Each Stage of the Pilot Study
Figure 1 Flow of participants through study.
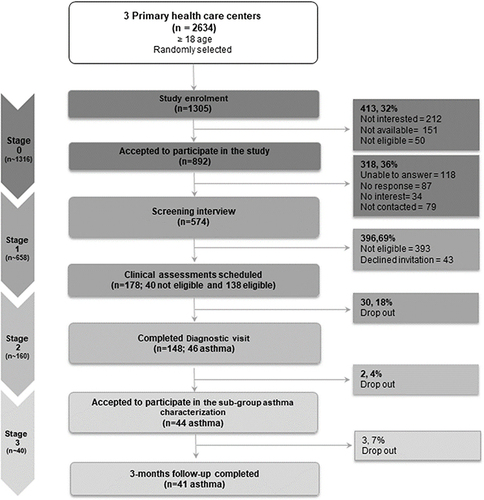
Table 2 Socio-Demographic and Clinical Characteristics of the Participants at Stage 1
Table 3 Socio-Demographic and Clinical Characteristics of the Participants at Stage 2
Figure 2 Clinical characteristics of patients with asthma, at stage 2 and 3 (N = 41).
Abbreviations: VAS, Visual Analogue Scale; GINA, Global Initiative for Asthma; CARAT, Control of Allergic Rhinitis and Asthma Test.
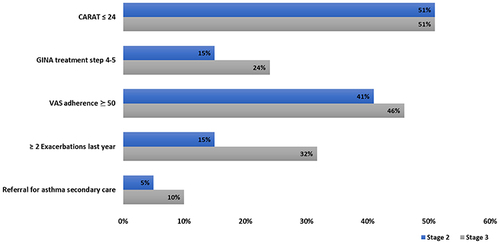
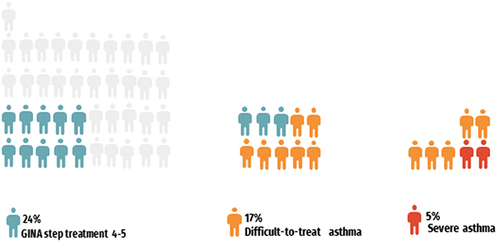
Figure 3 Waffle chart with the proportion of asthma patients per subset of asthma severity.
Abbreviation: GINA, Global Initiative for Asthma.