Figures & data
Table 1 Demographics, Clinical and Laboratory Features of the Patient Population
Table 2 List and Percentage of Comorbidities Within the Study Population
Figure 1 Annualized exacerbation rates (AER) of any severity (A) and for severe exacerbations (B) during benralizumab treatment in severe eosinophilic asthma (SEA) patients with BEC 300–450 cells/mm3 and in the total population (N=157 at baseline, N=135 at 48 weeks in the total population; N=32 at baseline, N=28 at 48 weeks in the BEC 300–450 subset); (C) Asthma control test (ACT) improvement at different timepoints in total population and BEC 300–450 subset; (D) Pre-BD FEV1 (pre-bronchodilator forced expiratory volume in the first second) change over time in total population and BEC 300–450 subgroup.
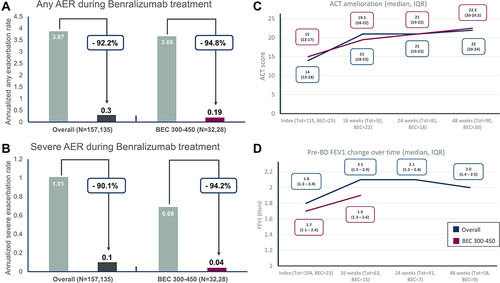
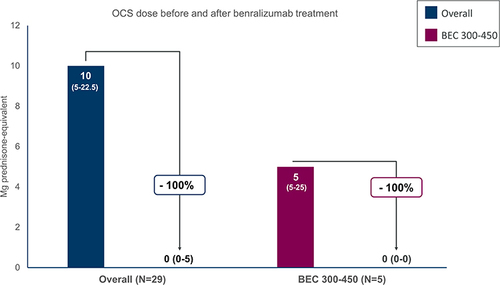
Table 3 OCS Reduction at End of Observation in the Patient Population
Figure 2 Oral corticosteroids (OCS) sparing effect of benralizumab in severe eosinophilic asthma (SEA) patients with BEC 300–450 cells/mm3 and in the total population. The dose is reported in milligrams of prednisone-equivalent.