
Figures & data
Table 1 Baseline Table: Comparison of Three Groups of Basic Information
Figure 1 Hematoxylin-eosin (HE) staining results of cell count in bronchoalveolar lavage fluid (A) H&E stained images of BALF specimens from patients with cough variant asthma (CVA), chronic cough and classical asthma (CA); (B) the number of macrophage counts, neutrophils, lymphocytes and eosinophils in BALF specimens, differences between the three groups were compared using Kruskal–Wallis test. ***P<0.001 is considered a significant difference compared to the chronic cough group, and ###P<0.001 shows a significant difference compared to the CA group.
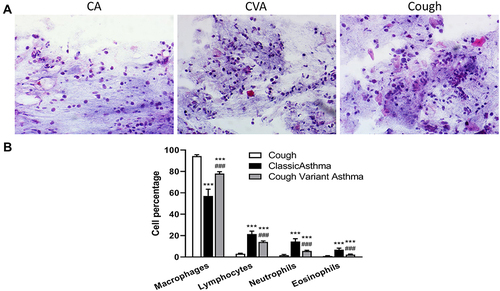
Figure 2 Th1 cytokine interferon-γ (IFN-γ) and Th2 cytokines interleukin 4 (IL-4), IL-5, IL-13, IL-18, and IL-25 in bronchoalveolar lavage fluid measured by enzyme-linked immunosorbent assay (ELISA) from cough variant asthma (CVA), chronic cough and classical asthma (CA) patients. Differences between the three groups were compared using the Kruskal–Wallis test. **P<0.01, ***P<0.001 shows a significant difference compared to the chronic cough group, and #P<0.05, ##P<0.01 shows a significant difference compared to the typical asthma group.
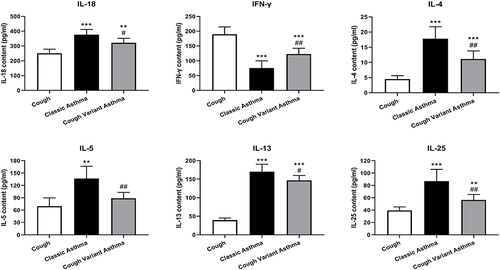
Table 2 Relationship Between Cell Count and Pulmonary Function
Table 3 Relationship Between Cytokines and Pulmonary Function