Figures & data
Figure 1 Study design. Three weeks before BT treatment baseline data were collected: BALF from the lingula and brushes from the left lower lobe. Six months after BT treatment BALF and brushes were collected from the treated lingula and left lower lobe, and untreated middle lobe. (Figure created with BioRender.com).
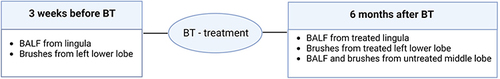
Table 1 Patient Characteristics at Baseline
Table 2 Gene Set Enrichment Analysis (GSEA) Showing the List of Differentially Expressed Gene Sets
Figure 2 Differentially expressed gene sets before and after BT treatment. (A) (upper panel: baseline (pre BT) versus after treatment (post BT)). Heatmaps of inflammatory genes for bronchial epithelial cells showing a non-significant difference between the baseline (pre BT) and treated airways (post BT). (A) (lower panel: untreated versus treated (after treatment)). Heatmaps of inflammatory genes for bronchial epithelial cells after BT showing a significant downregulation of the treated lobe compared to the untreated middle lobe. (B) (After treatment). Z-scores from heatmaps showing a significant difference between untreated middle lobe and treated lobes after BT (p<0.0001 = ****). There were no significant differences between responders (green dots) and non-responders (red dots). (C) (baseline versus after treatment). Z-scores from heatmaps showing a non-significant difference between the baseline (pre-BT) and treated airways (post-BT).
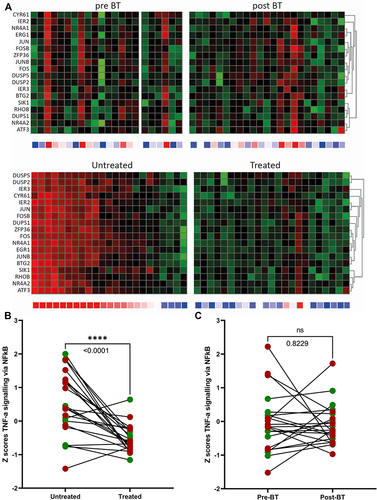
Figure 3 Differentially expressed inflammatory and glycolysis gene sets in the responder and non-responder groups. (A) After treatment: Heatmaps of inflammatory genes for bronchial epithelial cells are downregulated in treated airways compared to the untreated (middle) lobe. No differences between responders and non-responders were seen. (B and C) at baseline: Glycolysis gene expression in responders and non-responders. (B) Heatmaps of genes representing glycolysis showing that glycolysis genes are downregulated in responders. (C) Z-scores from glycolysis genes showing a significant difference between responders and non-responders.
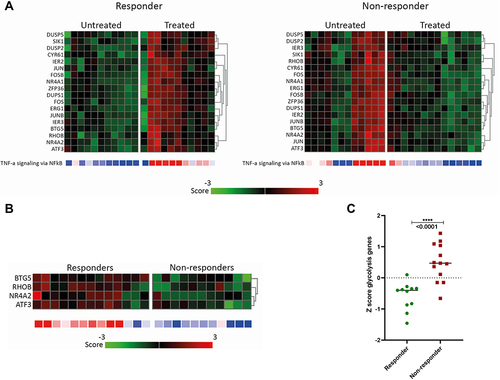
Figure 4 Differences at baseline between responders and non-responders. Mann–Whitney U-test analyses showed (A) difference in blood eosinophil count (p=0.006), (B) difference in BALF eosinophil count (p=0.02) and (C) difference between serum IgE (p=0.02) between responders and non-responders. * = p < 0.05.
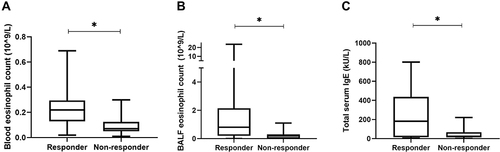
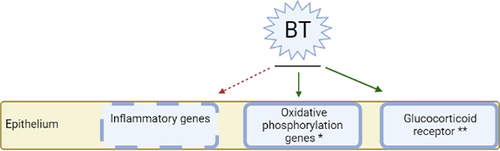
Figure 5 Proposed interaction between BT and inflammation. Inflammatory genes are downregulated after BT, whereas the expression of oxidative phosphorylation genes and glucocorticoid receptors is increased after BT, as described in other studies.Citation41,Citation42 *Described in study of Ravi et alCitation41 **Described in study of Papakonstantinou et alCitation42 (Figure created with BioRender.com).