Figures & data
Table 1 Baseline Demographics, Disease Characteristics, and Biomarker Levels of Patients with a Type 2 Phenotype (Blood Eosinophils ≥150 Cells/µL or FeNO ≥25 ppb) Who Were Sensitized to 1, 2, 3, or ≥4 Perennial Aeroallergens, or Non-Sensitized, at QUEST Baseline
Figure 1 Adjusted annualized severe exacerbation rates in patients with ≥150 eosinophils/µL or FeNO ≥25 ppb by sensitization. *P < 0.05, **P < 0.01, ***P < 0.001 vs matched combined placebo.
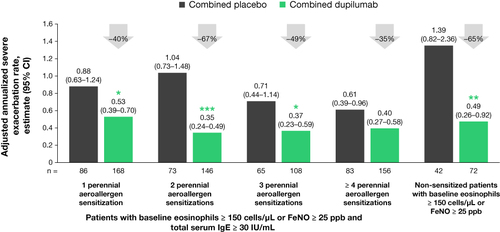
Figure 2 Pre-bronchodilator FEV1 over time in patients with ≥150 eosinophils/µL or FeNO ≥25 ppb by aeroallergen sensitization (A-E). *P < 0.05, **P < 0.01, ***P < 0.001 vs matched combined placebo.
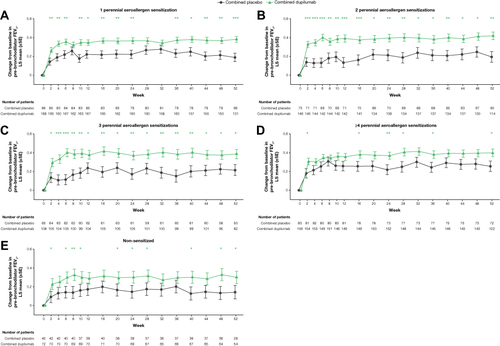
Figure 3 ACQ-5 score over time in patients with ≥150 eosinophils/µL or FeNO ≥25 ppb by sensitization (A-E). *P < 0.05, **P < 0.01, ***P < 0.001 vs matched placebo.
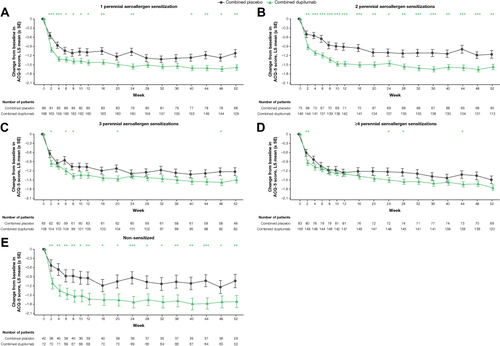
Figure 4 Median (95% CI) FeNO over time in patients with ≥150 eosinophils/µL or FeNO ≥25 ppb by sensitization (A-E). *P < 0.05, **P < 0.01, ***P < 0.001 vs matched placebo.
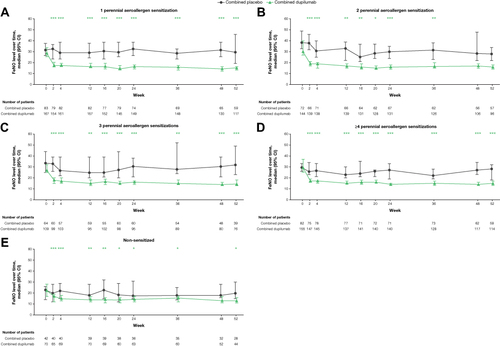
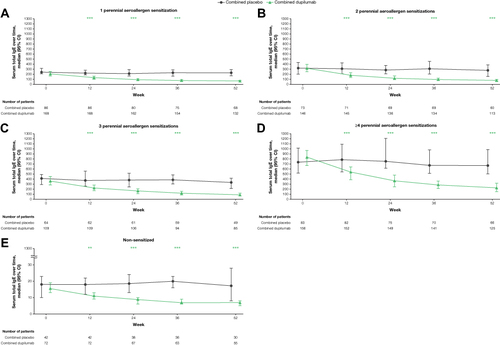
Figure 5 Median (95% CI) serum total IgE over time in patients with ≥150 eosinophils/µL or FeNO ≥25 ppb by sensitization (A-E). **P < 0.01, ***P < 0.001 vs matched placebo.