
Figures & data
Table 1 Baseline Characteristics (n=3016)
Table 2 Characteristic Data (n=3016)
Figure 1 Percentages of fever adverse effect in atopic and non-atopic patients and their atopic subgroups.
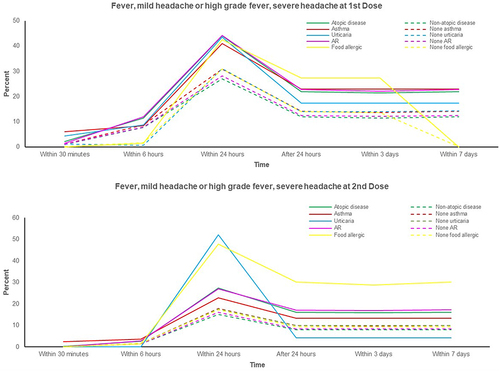
Figure 2 Percentages of skin rash (urticaria) adverse effect in atopic and non-atopic patients and their atopic subgroups.
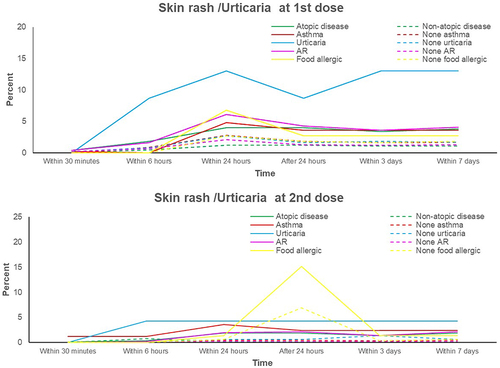
Figure 3 Percentages of local reactions adverse effect in atopic and non-atopic patients and their atopic subgroups.
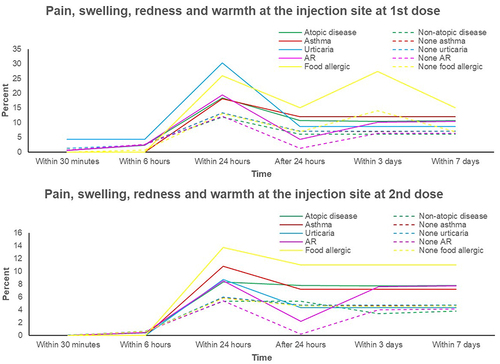
Figure 4 Percentages of nausea and vomiting adverse effect in atopic and non-atopic patients and their atopic subgroups.
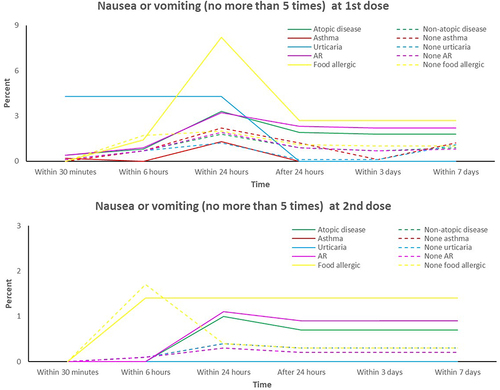
Table 3 Differences in Adverse Reactions of Live-Attenuated Oxford/AstraZeneca COVID-19 Vaccination Between Hypertension (n=616) and Non-Hypertension (n=2400) Groups
Table 4 Differences in Adverse Reactions of Live-Attenuated Oxford/AstraZeneca COVID-19 Vaccination Between Hyperthyroid (n=31) and Non-Hyperthyroid (n=2985) Groups
Table 5 Differences in Adverse Reactions of Live-Attenuated Oxford/AstraZeneca COVID-19 Vaccination Between Hyperlipidemia (n=359) and Non-Hyperlipidemia (n=2657) Groups