Figures & data
Table 1 Demographics (intent-to-treat population)
Figure 1 Comparison of ocular itching scores at 16 hours (A) and at 24 hours (B) after instillation of treatment. Mean itching for placebo, alcaftadine 0.25%, and olopatadine 0.2% at 3, 5, and 7 minutes after allergen challenge.
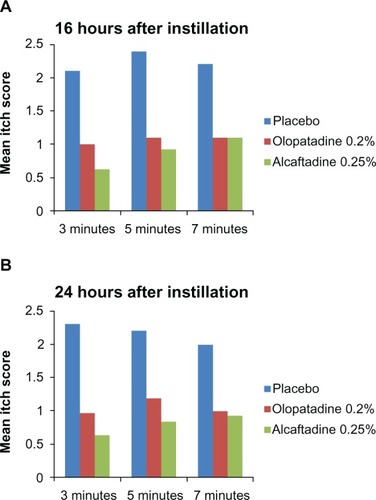
Table 2 Summary of ocular itching results (intent-to-treat population): differences versus placebo in mean ocular itching scores following CAC for alcaftadine 0.25% and olopatadine 0.2% at 16 and 24 hours
Figure 2 Reduction from baseline itch scores. A comparison of itch scores at visit 3 (16 hours; A) and at visit 4 (24 hours; B) with those from visit 2 (pretreatment baseline visit).
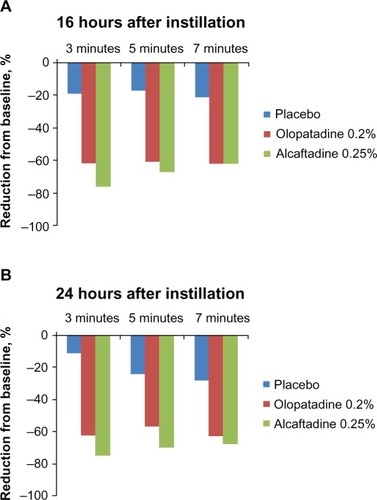
Figure 3 Comparison of minimal itch (scores < 1) data for placebo, alcaftadine 0.25%, and olopatadine 0.2% at 16 hours (A) and at 24 hours (B) after instillation of treatment.
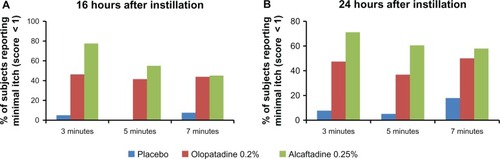
Figure 4 Comparison of zero itch data for placebo, alcaftadine 0.25%, and olopatadine 0.2% at 16 hours (A) and 24 hours (B) after instillation of treatment.
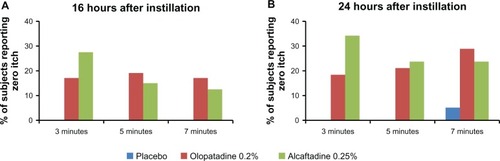
Figure 5 Percent of total subject-reported itching scores in each treatment group (A–C).
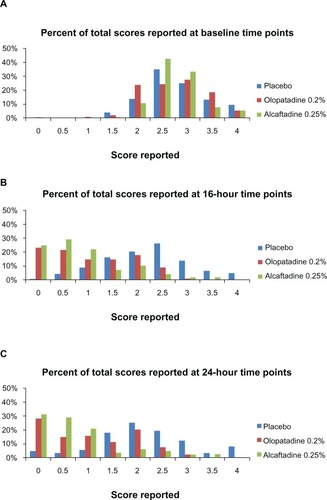
Table 3 Secondary endpoint data for both visits expressed as difference scores