
Figures & data
Table 1 Demographic and Clinical Characteristics in Patients with Idiopathic HE
Table 2 Clinical Manifestations of Study Subjects at Initial Presentation
Figure 1 Evaluation of organ involvement in patients with idiopathic hypereosinophilia.
Abbreviations: iHES, idiopathic hypereosinophilic syndrome; HEus, hypereosinophilia with undetermined significance; CT, computed tomography; APCT, abdominal and pelvic CT; PFT, pulmonary function test; EGDS, esophagogastroduodenoscopy; CFS, colonoscopy; BM, bone marrow examination.
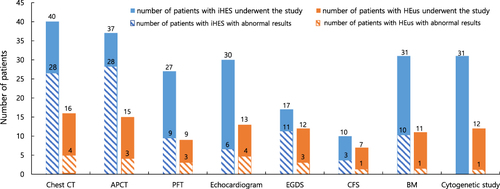
Figure 2 Treatment response of patients with iHES.
Abbreviations: iHES, idiopathic hypereosinophilic syndrome; CR, complete response; PR, partial response.
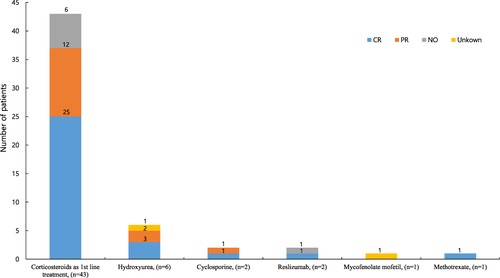
Figure 3 Treatment response of patients with HEus.
Abbreviations: HEus, hypereosinophilia with undetermined significance; CR, complete response; PR, partial response.
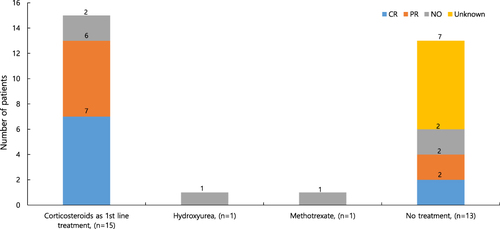
Table 3 Predictive Factors of Complete Response to Treatment in Patients with iHES