Figures & data
Table 1 The Demographic and Allergy Sensitization Characteristics of the Participants
Figure 1 Distribution of positive rates (A) and specific IgE levels (B) of cat, dog and horse dander allergens in 2377 subjects with suspected atopy.
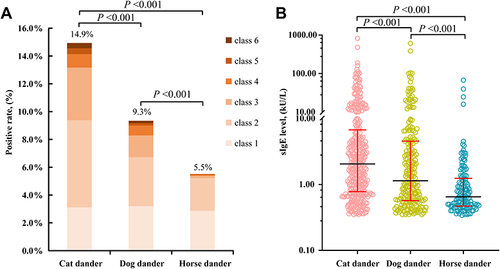
Figure 2 The co-sensitization between cat, dog and horse dander. The Venn Diagram shows the number of patients what were co-sensitized.
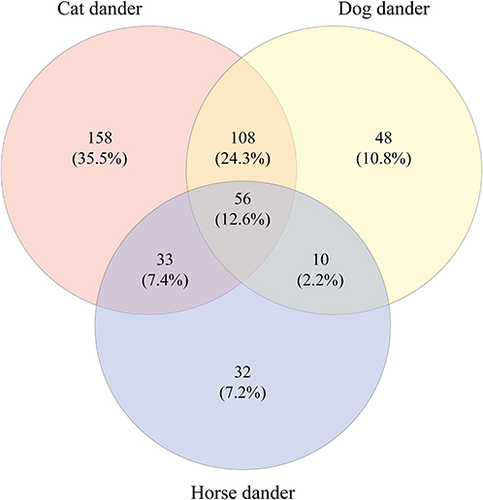
Figure 3 Distribution of furry animals sensitization rate in different age-groups. n - Total number of subjects in each age group.
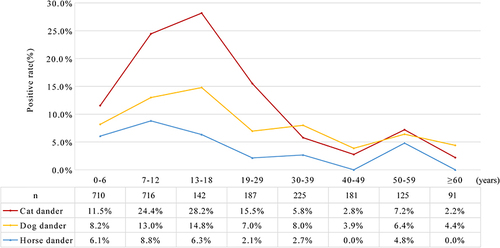
Figure 4 Heatmap for the prevalence of positive sIgE tests for cat dander (A), dog dander (B) and horse dander (C) in different regions. The prevalence (%) of each province were marked.
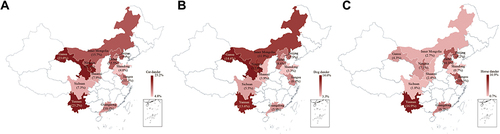
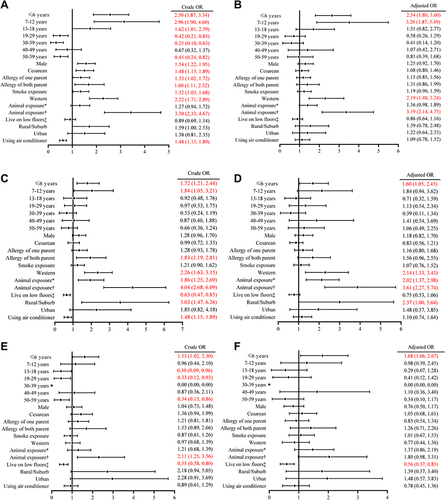
Figure 5 Risk factor analysis for animal allergen sensitization in patients with suspected allergic disease. Crude odds ratio and 95% CI of risk factors for cat sensitization (A), dog sensitization (C) and horse sensitization (E), adjusted odds ratio and 95% CI of risk factors for cat sensitization (B), dog sensitization (D) and horse sensitization (F). Multivariable-adjusted analysis included all factors in the univariate (crude) analysis. ORs of 1.00 indicate reference values. ORs associated with a P value of <0.05 are presented in red font. aOR - adjusted odds ratio. *No symptoms were reported after exposure to animal allergens. †Allergic symptoms were reported after exposure to animal allergens. ‡Patients living below the 9th floor.