
Figures & data
Figure 1 PRISMA flow diagram.
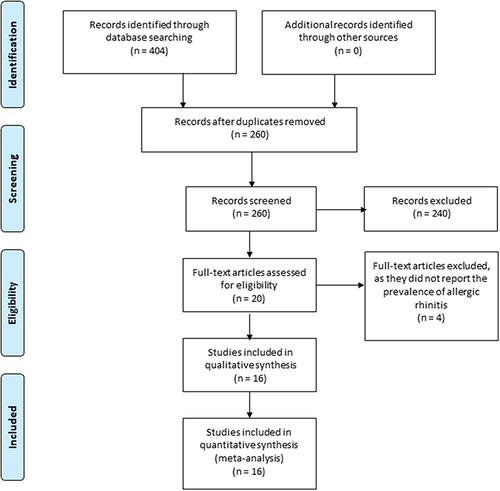
Table 1 Summary of the Included Studies
Figure 2 Overall prevalence of AR; shows the forest plot of the random effect estimated prevalence of AR.
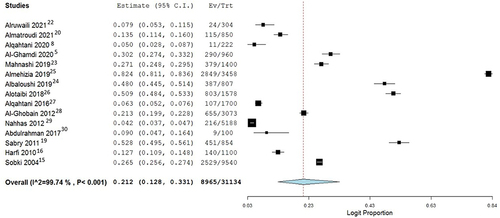
Figure 3 Sensitivity analysis of overall prevalence of AR; shows the sensitivity analysis of overall prevalence of AR.
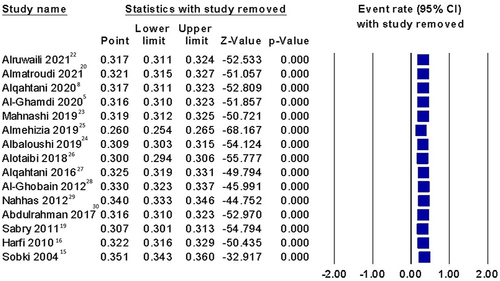
Figure 4 Funnel plot; shows the funnel plot of the overall prevalence of AR.
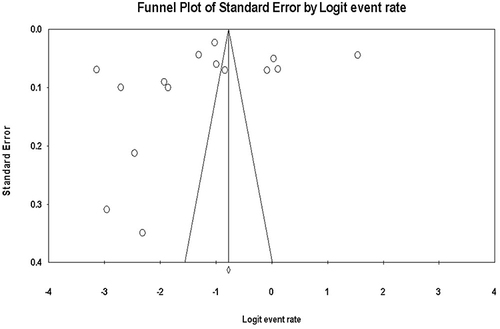
Figure 5 Prevalence of AR in females vs males; shows the forest plot of random-effect estimated odds ratio of the difference between males and females in terms of the prevalence of AR.
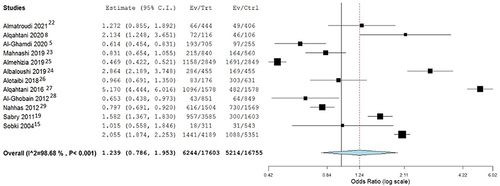
Table 2 Subgroup Analysis Based on the Demographic and Study Characteristics
Table 3 Associated Conditions, Including Asthma, Atopic Dermatitis, and Eczema
Table 4 Signs and Symptoms of AR
Table 5 Allergy Triggers
Table 6 Effect of AR on Life