Figures & data
Table 1 Patient Characteristics at Baseline (n=23)
Table 2 Change from Baseline After 2 Years in Asthma Patients with or Without Previous Biologics
Figure 1 Changes in clinical parameters before and after benralizumab treatment (A) Change in FEV1 from baseline in the bio-naïve group and switching group (B) Number of annual exacerbations in all patients, the bio-naïve group and the switching group (C) Change in ACT score from baseline in the bio-naïve group and switching group (D) Reduction rate of the OCS dose from baseline in the bio-naïve group and switching group. All data are presented as the mean. In (A), (B) and (C), the data were analyzed using the Wilcoxon signed-rank test. The upper and lower bars represent the standard errors in (A) and (C). *P < 0.05 compared with pre-BEN. **P < 0.05 compared with pre-MEP. †P <0.01 compared with pre-MEP.
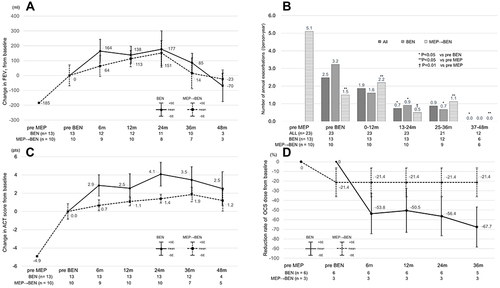
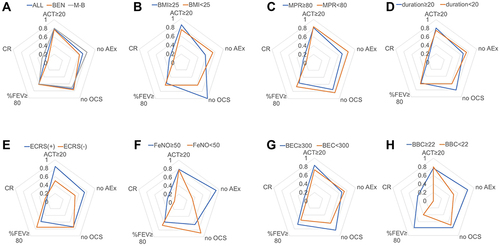
Figure 2 Achievement rates of clinical remission and the four criteria. This radar chart is composed of an ACT ≥ 20, no exacerbation, no maintenance OCS, a %FEV1 ≥ 80 and clinical remission. The analyses were conducted for (A) all patients, bio-naïve (BEN) patients and switching (M-B) patients; (B) patients with a BMI ≥ 25 and patients with a BMI < 25 (kg/m2); (C) patients with an MPR ≥ 80 and patients with an MPR < 80 (%); (D) patients with a disease duration ≥ 20 and patients with a disease duration < 20 (years); (E) ECRS (+) and ECRS (-) patients; (F) patients with a BEC ≥ 300 and patients with a BEC < 300 (/µL); (G) patients with a BBC ≥ 22 and patients with a BBC < 22 (/µL); and (H) patients with FeNO ≥ 50 and patients with FeNO < 50 (ppb).