
Figures & data
Table 1 Characteristics of the Patients at Baseline
Figure 1 Flowchart of patient inclusion with consecutive subdivision in patients with and without signs of MDD/GAD and their respective responder-status.
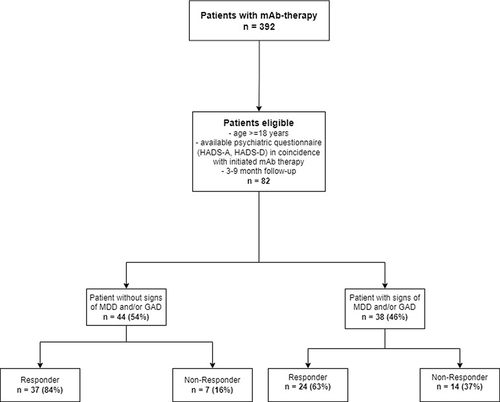
Figure 2 Comparison between baseline (BL) and follow-up (F/U) for (A) Asthma-Control Test (ACT), (B) Generalized Anxiety Disorder (GAD)-2 score, (C) Patients Health Questionnaire (PHQ)-2 score, (D) Quality of Life on Visual Analogue Scale (QoL-VAS), (E) Exacerbation counts and (F) Forced expiratory volume in one second (FEV1) subdivided in Responder and Non-Responder. Data are presented as boxplots. The bars show the median value, the lower and upper ends correspond to the first and third quantiles (25th and 75th percentiles). The upper whisker extends from the upper edge of the boxplot to the highest value, the lower whisker extends from the lower edge of the boxplot to the smallest value.
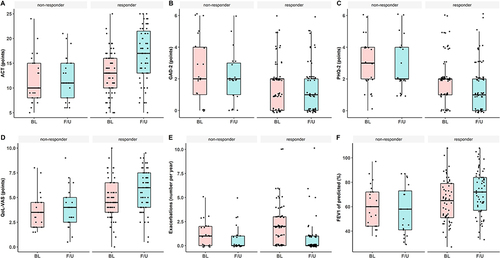
Table 2 Psychological Disorder Prevalence Rates in Patient with Severe Asthma Compared to German Population
Table 3 Comparison Between Responders and Non-Responders
Table 4 Multivariate Analysis of Impact on Non-Responding to mAb-Therapy