Figures & data
Table 1 Patient Characteristics and Sputum Cytology
Table 2 Sputum Signaling Molecules
Figure 1 TGF-β1 levels of asthmatics with FAO and non-FAO (nFAO) in the presence or absence of airway eosinophilia as indicated. TGF-β1 was quantified by ELISA in sputum fluid of FAO and nFAO asthmatic patients with sputum eosinophilia and without sputum eosinophilia. Results are depicted as bar column, with median values, 25th and 75th quartile and the range of values. Mann–Whitney U-test was used for the statistical analysis, and there was no statistical significance within group and associated P values between groups are indicated. ***P < 0.001.
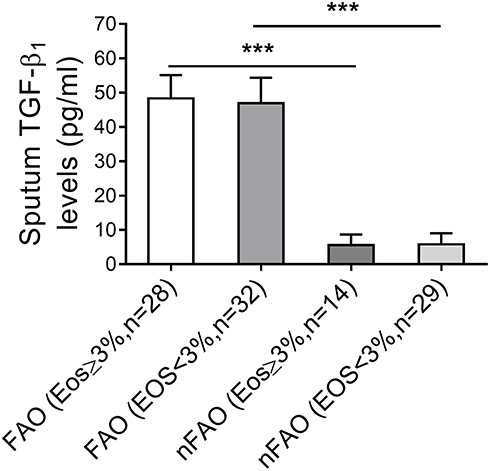
Figure 2 The levels of TAK1 and p-TAK1 in total sputum cells was analyzed by Western blot analysis of whole cell lysate from asthmatics with FAO and without FAO (non-FAO). GAPDH served as the standard.
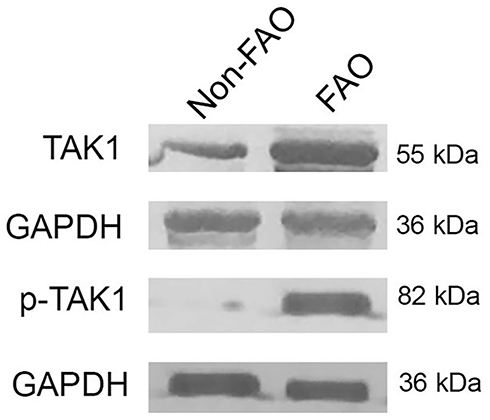
Figure 3 Correlations between total TAK1 immunopositive cells in sputum of asthmatics with FAO, expressed as percentage, and the pulmonary function tests, including pre-bronchodilator (A) and post-bronchodilator FEV1/FVC ratios (B). Spearman rank correlation has shown significant negative correlations between TAK1 levels and FEV1/FVC ratios.
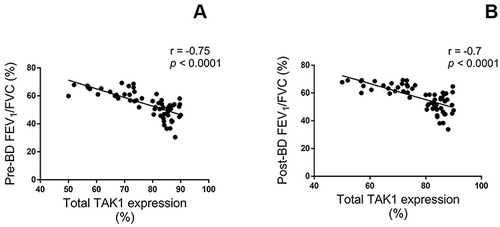
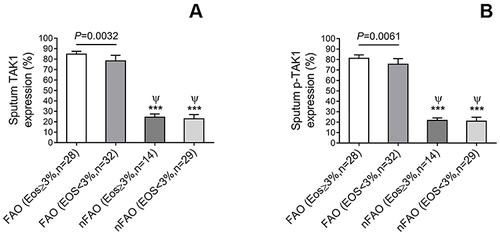
Figure 4 TAK1 and p-TAK1 immunopositive cells (%) in sputum of asthmatics with FAO and without FAO (nFAO) in the presence or absence of airway eosinophilia as indicated. (A) The difference in TAK1 immunopositive cell numbers within and between groups. (B) The difference in p-TAK1 immunopositive cell numbers between patients with and without airway eosinophilia. Results are depicted as bar, column, with median values, 25th and 75th quartile and the range of values. Mann–Whitney U-test and associated P-values are indicated. ***P < 0.001 for comparison with FAO with eosinophilia. ψ for comparison with FAO without eosinophilia (P < 0.001).