Figures & data
Table 1 Demographic and Clinical Data of the Final Study Population
Figure 1 Limitations and implications on daily activities.
Notes: AD and non-AD related limitations in the AD group vs any health limitation in the non-AD group (A); specific daily limitations in the AD population (B). *Statistically significant (p≤0.05).
Abbreviation: AD, atopic dermatitis.
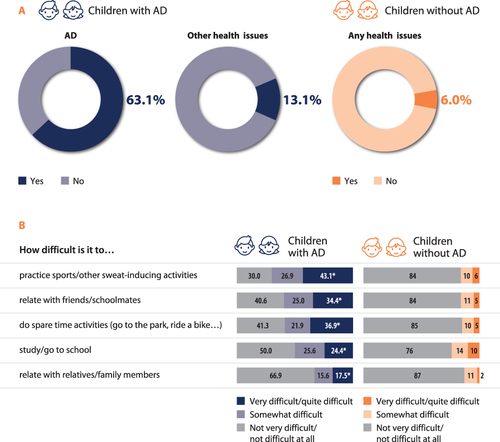
Figure 2 Emotional burden.
Notes: Emotional burden of atopic dermatitis expressed as positive and negative feelings (A). (B) shows behaviors and beliefs associated with atopic dermatitis. *Statistically significant (p≤0.05).
Abbreviation: AD, atopic dermatitis.
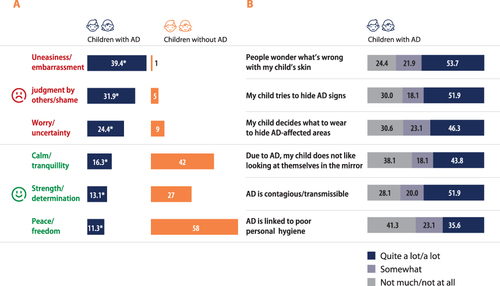
Figure 3 Sleep impairment and daily drowsiness.
Notes: Quality of sleep for parents and children with or without atopic dermatitis over the past year (A). The average score is on a 0 to 10 scale. Number of nights with poor sleep (B) and days with drowsiness (C). a,b,c,*,**,***,****Statistically significant (p≤0.05).
Abbreviation: AD, atopic dermatitis.
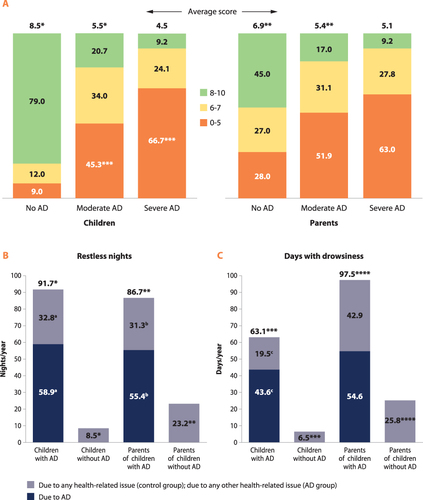
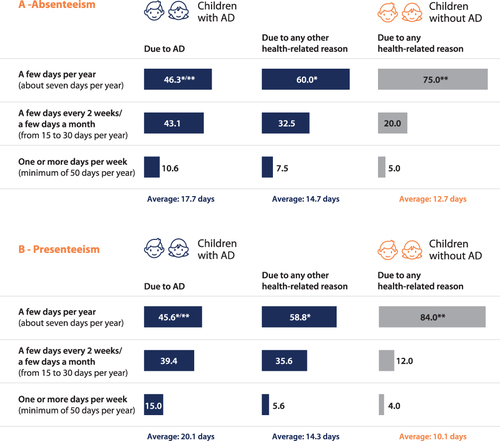
Figure 4 Absenteeism and presenteeism.
Notes: Absenteeism as number of days of school missed over the past 12 months (A) and presenteeism as number of days with decreased focus/functionality (B) due to atopic dermatitis or any/any other health-related issue over the past 12 months. Data expressed as percentages and average. *,**Statistically significant (p≤0.05).
Abbreviation: AD, atopic dermatitis.