Figures & data
Figure 1 MicroRNA-target gene-mechanism network. (A) Venn diagrams of predicted target genes. (B) The network of microRNAs and their targets. Green circular nodes represent target genes, pink diamond nodes represent microRNAs, gray lines representing not experimentally validated by miRTarBase7.0, and blue lines represent experimentally validated by miRTarBase7.0. (C) The GO term of targeted genes of co-downregulated microRNAs. The Y-axis label represents Enrichment Score (The GO ID’s Enrichment Score value equals (-log10 (P value)). The X-axis label represents the GO ID and the number of genes associated with the listed GO ID. Red, green, and blue represent biological process, cellular component, and molecular function, respectively.
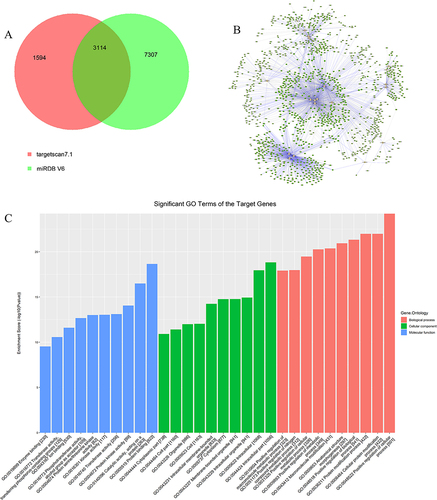
Figure 2 The tissue remodeling in response to OVA treatment in mice. (A) Timeline of the experimental protocol. (B) Respiratory system resistance test of mice model (***, P<0.001). (C) the levels of OVA-specific Ig E in the serum of mice model tested by ELISA, (***, P<0.001). (D) Representative photomicrographs of lung sections stained with H&E were present in OVA-induced asthmatic mice (down) and PBS-treated control mice (up), scale bar=50um. (E) Representative photomicrographs of lung sections stained with IHC (left), and IHF (right). Marked smooth muscle layers by α-SMA were present in OVA mice (down) and PBS mice (up) (blue: DAPI; green: α-SMA), scale bar=50um.
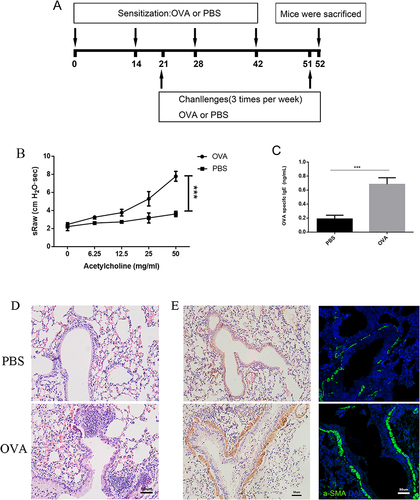
Figure 3 The effects of miR107 on the proliferation and migration of ASMCs. (A) the expressions of miR107 in primary ASMCs were compared between PBS-treated control mice and OVA-treated asthmatic mice by RT-qPCR (*, P<0.05). (B and C) EDU staining (red) showing quantitative data (C) and representative images ((B) left for negative control ASMCs, right for mimic miR107-treated AMSCs), nuclei stained with DAPI, and a-SMA in green, P*<0.05. (D and E) transwell cell migration assay showing quantitative data (E) and representative images ((D); left for negative control ASMCs, right for mimic miR107-treated AMSCs),(*, P<0.05).
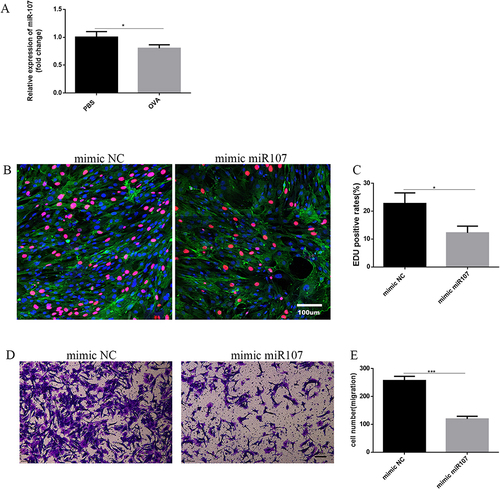
Figure 4 Interaction between miR107 and Cdk6 as well as Rb. (A) predicted binding site between miR107 and Cdk6 3’UTR / mutant Cdk6 3’UTR. (Red: Cdk6 site; green: mutant Cdk6 site). (B) Dual luciferase assay of miR107 on Cdk6 (**, P<0.01; ns, P>0.05). (C and D), Effects of miR107 on Cdk6 protein expression were analyzed in ASMCs by Western blot (C) and statistical analysis (D), all group P<0.05. (E and F) Effects of miR107 on Cdk6 and p-Rb expression were analyzed in ASMCs cultured with PDGF-BB by Western blot (E) and the statistical analysis(F), (*, P<0.05).
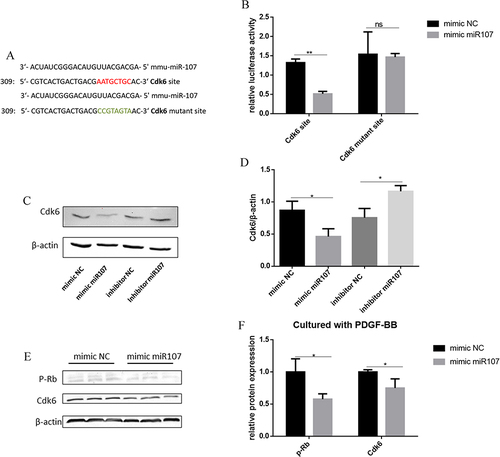
Figure 5 Up-regulation of Cdk6 reverses the effects of miR107 on the proliferation of ASMCs. (A and B) EDU staining (red) showing quantitative data (B) and representative images ((A); left for negative control ASMCs, right for siCdk6-treated AMSCs), and nuclei stained with DAPI, (**, P<0.01). C, the transfection efficiency of siCdk6 in ASMCs tested by Western blot. (D and E) EDU staining (red) showing quantitative data (E) and representative images ((D); left for mimic NC &vector NC co-transfection group, middle for mimic 107 &vector NC co-transfection group and right for mimic 107 &vector Cdk6 co-transfection group), and nuclei stained with DAPI (***, P<0.001; *, P<0.05); (F) the transfection efficiency of vector Cdk6 tested by Western blot.
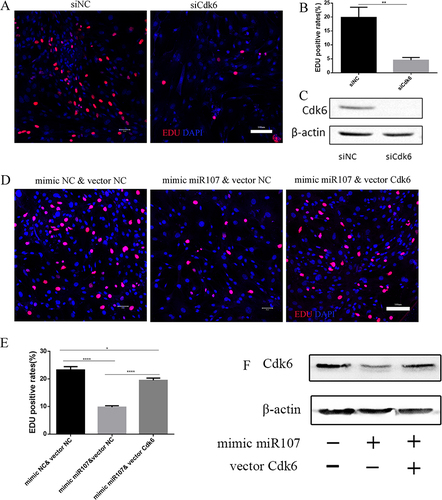
Figure 6 Rb was involved in the effect of miR107 on the proliferation of ASMCs. (A) the transfection efficiency of RNAi siRb in ASMCs tested by RT-qPCR (*, P<0.05). (B and C) EDU staining (red) showing quantitative data (C) and representative images ((B); left for negative control ASMCs, right for siRb-treated AMSCs), and nuclei stained with DAPI), (***, P<0.001). (D and E) EDU staining (red) showing quantitative data (E) and representative images ((D); left for mimic NC & siNC co-transfection group, middle for mimic miR107 & siNC co-transfection group and right for mimic 107 & siRb co-transfection group), and nuclei stained with DAPI, (***, P<0.001; **, P<0.01; ns, P>0.05).
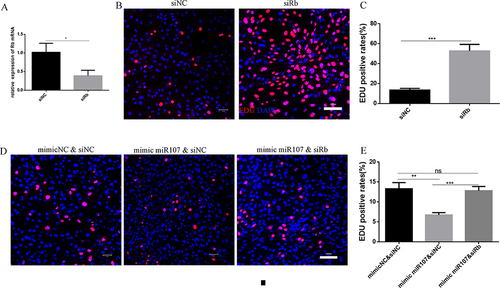
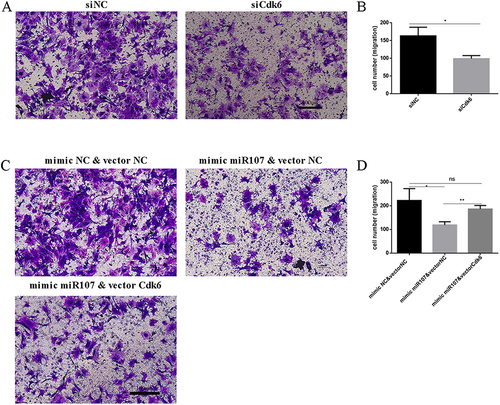
Figure 7 Up-regulation of Cdk6 partially reversed the effect of miR107 on the migration of ASMCs. (A and B) transwell cell migration assay showing quantitative data (B) and representative images ((A); left for negative control ASMCs, right for siCdk6-treated AMSCs), (*, P<0.05). (D and C) transwell cell migration assay showing quantitative data (D) and representative images ((C); up-left for mimic NC &vector NC co-transfection group, up-right for mimic 107 & vector NC co-transfection group and down-left for mimic 107 & vector Cdk6 co-transfection group), (**, P<0.01; *, P<0.05; ns, P>0.05).