Figures & data
Figure 1 Study population.
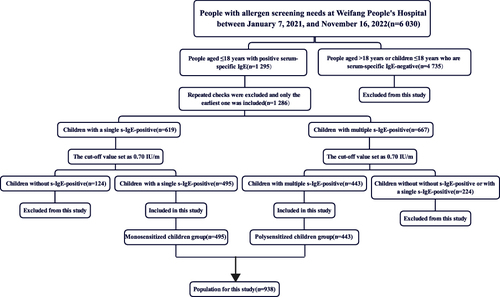
Figure 2 Overview of allergen distribution in monosensitized children (n=495). (A) Distribution of allergens in the age group of monosensitized children. (a) Radial bar chart: 15 common allergens; (b) Radial bar chart: 5 major groups of allergens. (B) Analysis of the proportion of the five major allergen groups in the age group of monosensitized children. (C) Trend analysis of the proportion of the five major allergen groups in the age group of monosensitized children.
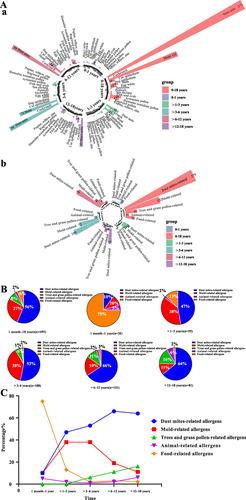
Figure 3 Overview of allergen distribution in polysensitized children (n=443). (A) Characteristics of the 5 major groups of allergens in polysensitized children. (B) Characteristics of 15 allergens in polysensitized children. (C) Distribution of allergens in age groups of polysensitized children. (a) Radial bar chart: 15 common allergens; (b) Radial bar chart: 5 major groups of allergens. (D) Overlap profiles of the 5 major allergen groups in the age grouping of polysensitized children.
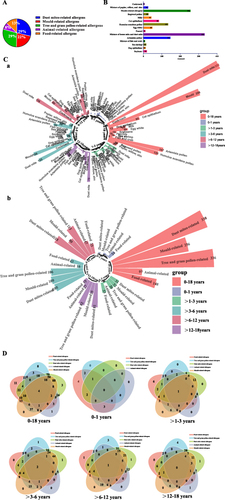
Figure 4 Combinations between 15 allergens in polysensitized children.
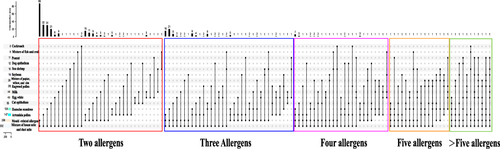
Figure 5 An overview of the overall proportion of the five major allergens in monosensitized and polysensitized children.
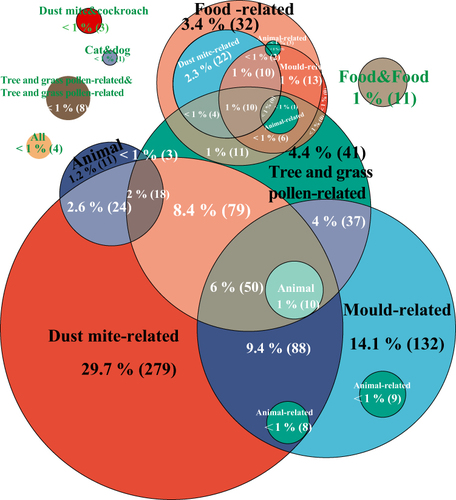
Figure 6 Comparative analysis of monosensitized and polysensitized children. (A) Overview of the number of monosensitized and polysensitized children in the overall cohort. (B) Gender differences in monosensitized and polysensitized children. (C) Percentage of eggs in infants among monosensitized and polysensitized children. (D) Differences in the proportions of dust mite-related allergens and mould-related allergens among monosensitized and polysensitized children. E. Differences in serum antibody levels to dust mite-related allergens and mould-related allergens in monosensitized and polysensitized children. (Ea): Dust mite-related allergens; (Eb): Mould-related allergens. (F) Differences in the proportion of high levels of sIgE in monosensitized and polysensitized children. (Fa): Dust mite-related allergens; (Fb): Mould-related allergens. (G) Differences in serum antibody levels of high levels of sIgE in monosensitized and polysensitized children. (Ga): Dust mite-related allergens; (Gb): Mould-related allergens. Significance *p < 0.05, **p < 0.01, and ***p < 0.001.
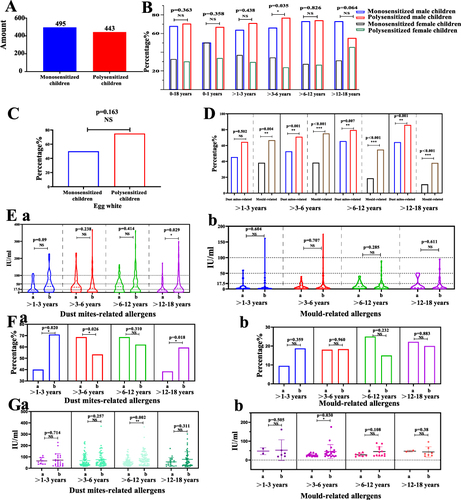
Table 1 Differences Between Monosensitized and Polysensitized Children
Table 2 Differences in T-IgE and Clinical Parameters Between Monosensitive and Multisensitive Children
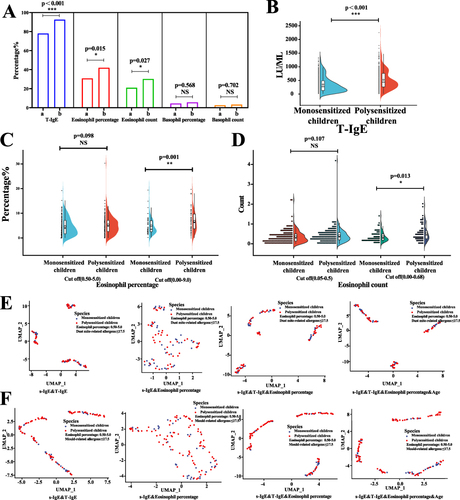
Figure 7 Differences in T-IgE and clinical parameters in monosensitized and polysensitized children. (A) Differences in the percentage of positive numbers for T-IgE and clinical parameters in monosensitized and polysensitized children. (a): Monosensitized children; (b): Polysensitized children. (B) Differences in T-IgE serum antibodies in monosensitized and polysensitized children (n=938). (C) Differential analysis of the number of eosinophils percentage in monosensitized and polysensitized children. (D) Differential analysis of the number of eosinophils count in monosensitized and polysensitized children. (E) Dimensional reduction analysis of monosensitized and polysensitized children at low levels of dust mite-related allergens. (F) Dimensional reduction analysis of monosensitized and polysensitized children at low levels of mould-related allergens. Significance *p < 0.05, **p < 0.01, and ***p < 0.001.