Figures & data
Figure 1 PRISMA flow diagram summarizing the selection process for publications included in the review.
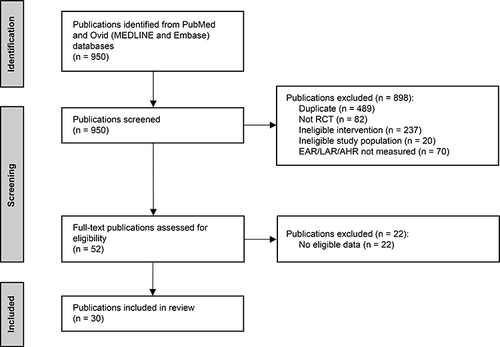
Table 1 Characteristics of the Included Trials and Publications
Table 2 Baseline Demographic and Clinical Characteristics
Figure 2 Summary of included studies of biologic therapies and their effects on AHR in asthma. ↓Indicates that the biologic agent significantly reduced the AHR and significant results are highlighted by bolded text; ↔Indicates that the biologic therapy had no effect on the AHR. NS (NR) indicates when a p value was non-significant, but the value was not reported. ap values as reported in the publications cited. bAHR was the primary outcome of the study. cReduction in AHR to AMP at week 4 but not at week 12. dPatients with refractory asthma who participated in the crossover part of the study.
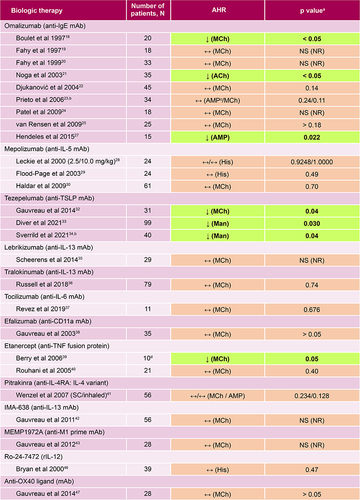
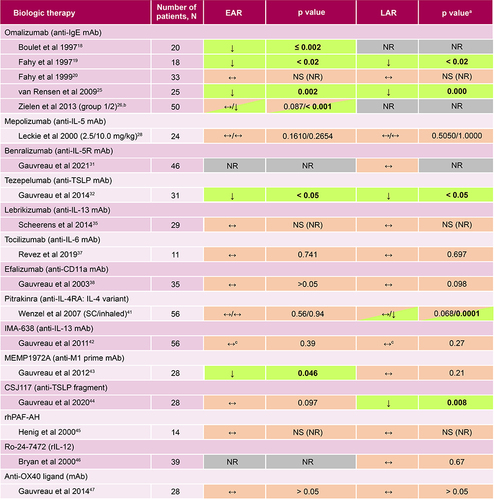
Figure 3 Summary of included studies of biologic therapies and their effects on the EAR and LAR in asthma. ↓Indicates that the biologic agent significantly reduced the EAR or LAR and significant results are highlighted by bolded text; ↔Indicates that the biologic therapy had no effect on the EAR or LAR. NS (NR) indicates when a p value was non-significant but the value was not reported. ap values as reported in the publications cited.bGrouped according to screening IgE levels; group 1: 30–300 IU/mL (low IgE); group 2: 700–2000 IU/mL (high IgE). cReduction at day 14 but not at day 35.