Figures & data
Figure 1 The calculation process of indices from the MBPT.
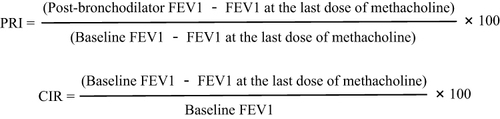
Figure 2 Primary and second outcomes. Primary outcomes: Acute exacerbation (no versus yes); ACT(2) (<19 versus ≧19); MiniAQLQ(2) - MiniAQLQ(1) (<0 versus >0). Second outcome: Cumulative number of EDHO. Independent variable: PRI(1).
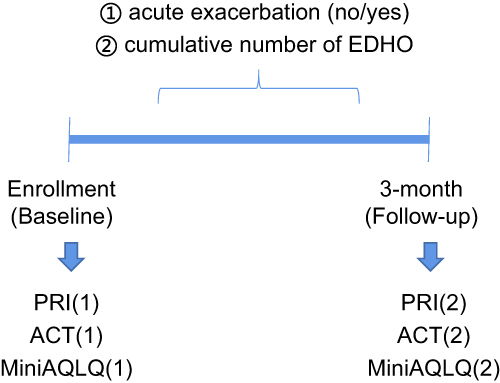
Table 1 Baseline Characteristics
Table 2 Comparison Between the Baseline and the 3-Month Follow-Up Visit
Table 3 Collinearity Diagnostics for Logistic Regression Models
Table 4 Relationships Between PRI and Clinical Outcomes
Table 5 Relationships Between PRI and the Four Domains of MiniAQLQ
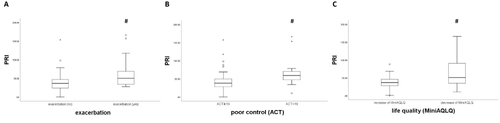
Figure 3 Comparison of percent recovery index (PRI) between different state of asthmatics. (A) Acute exacerbations: During the follow up of 3 months (no vs yes). (B) Poor asthma control: ACT at 3 months (≧19 vs <19); (C) Decreased life quality: MiniAQLQ at 3 months - MiniAQLQ at baseline (>0: increase of MiniAQLQ vs <0: decrease of MiniAQLQ). The horizontal lines: the median. Boxes: the interquartile range (IQR; Q1–Q3). Whiskers: Q1−1.5×IQR (lower) and Q3+1.5×IQR (upper). Circle: outliers on the outside of Q1−1.5×IQR and Q3+1.5×IQR. *Outliers on the outside of Q1−3×IQR and Q3+3×IQR. #P<0.05 vs normal control group.