Figures & data
Table 1 Details of GEO Asthma Date
Figure 1 The overall protocol of this study.
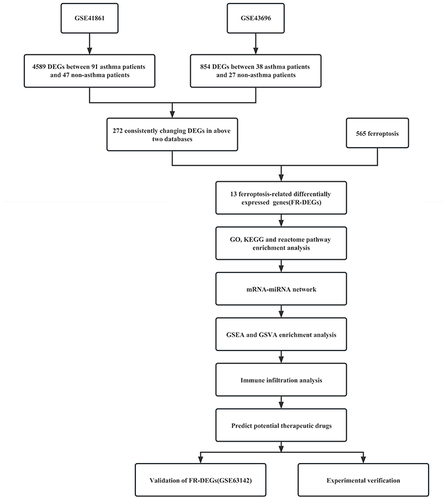
Table 2 The Primers Used in This Study
Figure 2 The expression matrices of the GSE43696 and GSE41861datasets were normalized. (A) Boxplot of asthma and non-asthma in the GSE41861dataset; (B) Boxplot of asthma and non-asthma in the GSE43696 dataset. The green boxplot represents the asthma sample and the blue boxplot represents the control sample; (C) PCA diagrams of asthma and non-asthma in the GSE41861dataset; (D) PCA diagrams of asthma and non-asthma in the GSE43696 dataset.
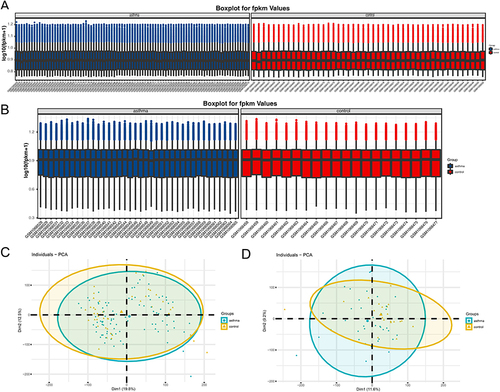
Table 3 13 FR-DEGs Has Been Identified as Downregulated or Upregulated in Asthma
Figure 3 FR-DEGs of the GSE41861 and GSE43696 datasets. (A) The volcano plot presenting the DEGs in asthma and non-asthma in the GSE41861 dataset; (B) The volcano plot presenting the DEGs in asthma and non-asthma in the GSE43696 dataset. Red, upregulated genes; green, downregulated genes; black, no significant differences; (C) Venn diagram of DEGs, DEGs in the GSE41861 and GSE43696 datasets of asthma and non-asthma; (D) Venn diagram of FR-DEGs, the intersection of common DEGs of asthma and non-asthma in GSE41861 and GSE43696 datasets and ferroptosis database genes; (E) Heat maps of 13 FR-DEGs from the GSE41861 dataset; (F) Heat maps of 13 FR-DEGs from the GSE43696 dataset. The color of the small squares represents the size of the gene expression, with red representing high-expression genes and blue representing low-expression genes.
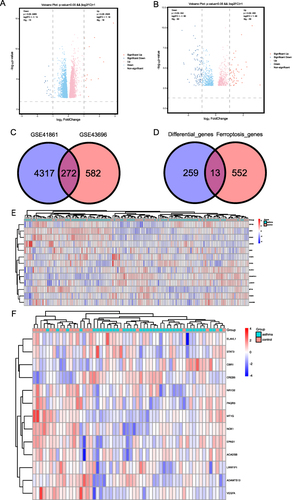
Figure 4 Enrichment functional analyses of the 13 FR-DEGs. (A) Bubble plot of GO enrichment analysis of the 13 FR-DEGs; (B) Circle diagram of GO enrichment analysis of the 13 FR-DEGs. (C) Bubble plot of KEGG enrichment analysis of the 13 FR-DEGs. (D) Bubble plot of Reactome pathway analysis of the 13 FR-DEGs.
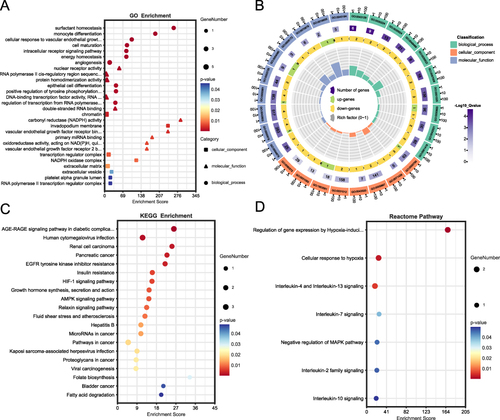
Figure 5 MiRNA-mRNA regulatory network of FR-DEGs. The network included 191 nodes (178 miRNAs and 13 genes) and 370 edges.
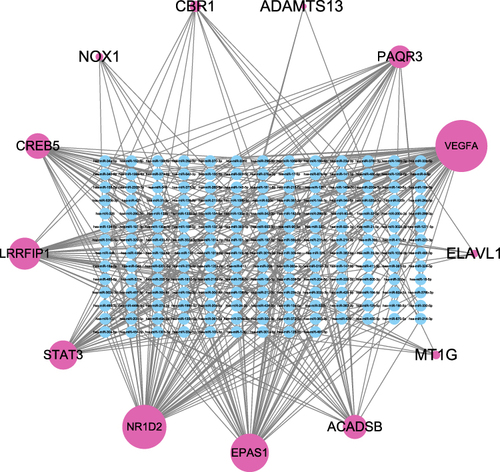
Figure 6 Single-gene GSEA enrichment analysis in 13 FR-DEGs. (A) ACADSB, (B) ADAMTS13, (C) CBR1, (D) CREB5, (E) ELAVL1, (F) EPAS1, (G) LRRFIP1, (H) MT1G, (I) NOX1, (J) NR1D2, (K) PAQR3, (L) STAT3, (M) VEGFA.
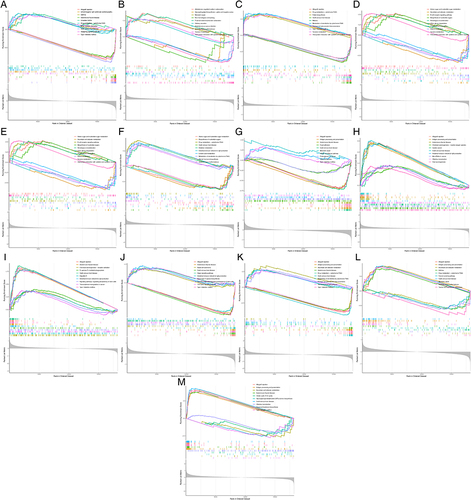
Figure 7 GSVA pathway analysis. High‐ and low‐expression groups in asthma-vs-controls (A) and controls -vs- asthma (B).
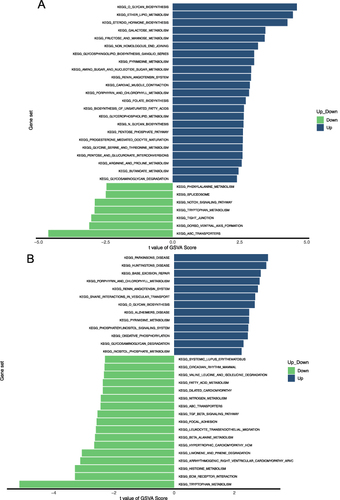
Figure 8 Immune infiltration analysis. (A) Immune landscape analysis between asthma and non-asthma samples which implemented the CIBERSORT algorithm. (B) Pearson correlation analysis between 13 FR-DEGs and immune cells. *P<0.05, **P≤0.01, ***P≤0.001, ****P≤0.0001.
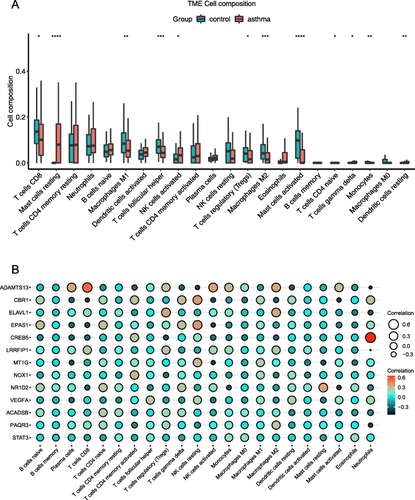
Figure 9 Prediction of gene‐targeted drugs (VEGFA, STAT3, NOX1, ELAVL1, EPAS1 and CBR1), The drugs may target genes through the DGIdb database.
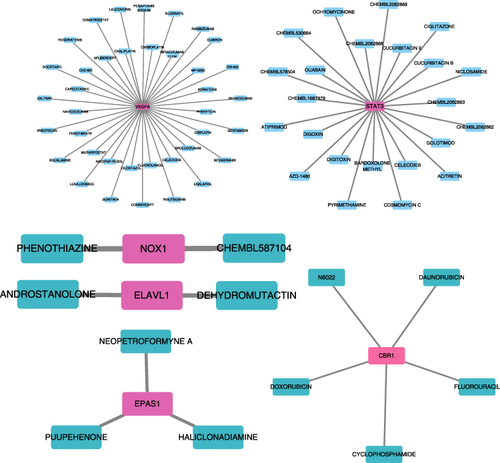
Figure 10 Expression levels of the 10 FR-DEGs in asthma and non-asthma in the GSE631421 dataset. (A) ADAMTS13’ expression in the GSE631421 dataset; (B) CBR1’ expression in the GSE631421 dataset; (C) ELAVL1’ expression in the GSE631421 dataset; (D) CREB5’ expression in the GSE631421 dataset; (E) EPAS1’ expression in the GSE631421 dataset; (F) LRRFIP1’ expression in the GSE631421 dataset; (G) MT1G’ expression in the GSE631421 dataset; (H) NOX1’ expression in the GSE631421 dataset; (I) NR1D2’ expression in the GSE631421 dataset; (J) VEGFA’ expression in the GSE631421 dataset. *P<0.05, **P≤0.01, ***P≤0.001, ****P≤0.0001.
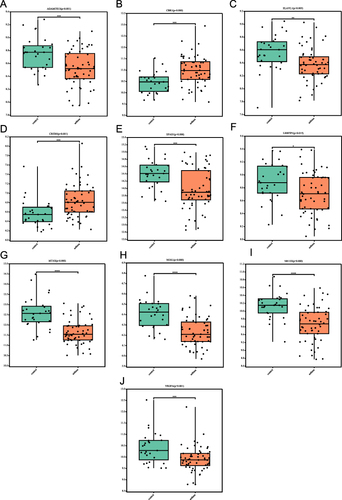
Figure 11 Diagnostic ROC curves of 10 FR-DEGs in the GSE631421 dataset. (A) ROC curve of ADAMTS13; (B) ROC curve of CBR1; (C) ROC curve of ELAVL1; (D) ROC curve of CREB5; (E) ROC curve of EPAS1; (F) ROC curve of LRRFIP1; (G) ROC curve of MT1G; (H) ROC curve of NOX1; (I) ROC curve of NR1D2; (J) ROC curve of VEGFA.
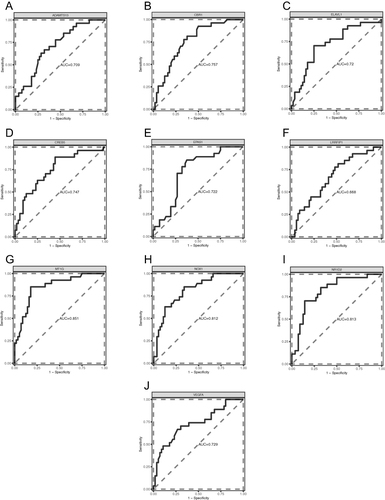
Table 4 Characteristics of Asthma and Control in This Study
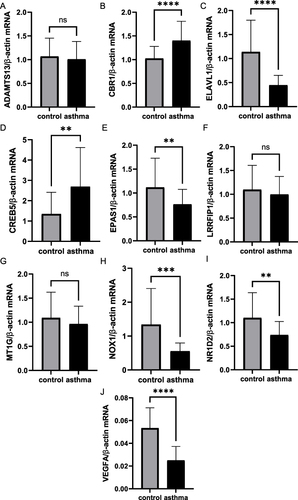
Figure 12 Validation of mRNA levels of 10 FR-DEGs in asthma patients and healthy controls. (A) mRNA levels of ADAMTS13; (B) mRNA levels of CBR1; (C) mRNA levels of ELAVL1; (D) mRNA levels of CREB5; (E) mRNA levels of EPAS1; (F) mRNA levels of LRRFIP1; (G) mRNA levels of MT1G; (H) mRNA levels of NOX1; (I) mRNA levels of NR1D2; (J) mRNA levels of VEGFA. **P≤0.01, ***P≤0.001, ****P≤0.0001.