
Figures & data
Figure 1 Differential expression analysis. The volcano plot (A-D) and heatmap (E-H) of DEmiRNAs (A and E), DEcircRNAs (B and F), DElncRNAs (C and G) and DEmRNAs (D and H).
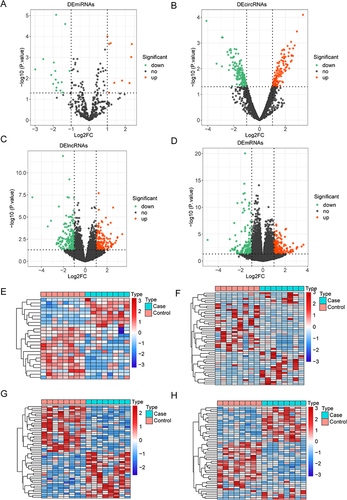
Figure 2 The ceRNA network. The size of the point indicates the connectivity. The greater the point is, the greater the connectivity is. Circular nodes represent miRNA, triangular nodes represent circRNA, square nodes represent mRNA, and diamond nodes represent lncRNA.
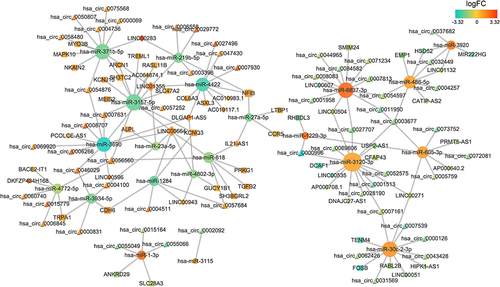
Figure 3 The enrichment analysis results of mRNA in the ceRNA network. (A) The CC terms and, top 10 BP and MF terms. (B) The enriched KEGG pathways and Reactome pathways. (C) The top 20 disease and function terms enriched by mRNA in the ceRNA network.
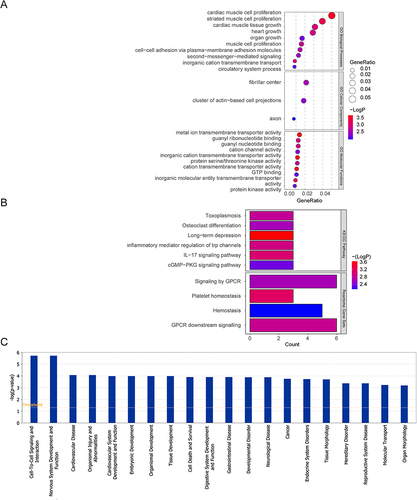
Table 1 The List of Transcription Factors Regulating the Characteristic Genes
Figure 4 Identification of characteristic genes. (A) The characteristic genes were screened by LASSO regression analysis. Left image: The horizontal axis represents log (Lambda), and the vertical axis represents the coefficient of genes (left); Right image: The horizontal axis represents log (Lambda), while the vertical axis represents the error of cross validation (right). In practical analysis, we hope to find the location with the smallest cross validation error. In the right graph, the left dashed line position is the location with the smallest cross validation error. Based on this position (lambda. min), the corresponding horizontal coordinate log (Lambda) is determined. The number of feature genes is displayed on the top, and the optimal log (Lambda) value is found. The corresponding gene and its coefficient are found in the left graph. (B) The ROC curve of LASSO regression model. (C) The single gene ROC curve of characteristic gene.
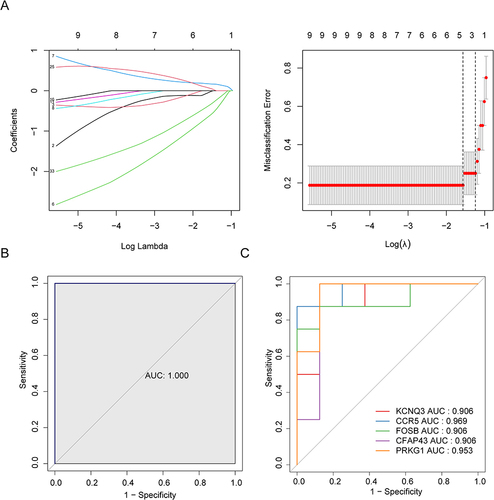
Figure 5 The ceRNA network for characteristic genes. The size of the point indicates the connectivity. The greater the point is, the greater the connectivity is. Circular nodes represent miRNA, triangular nodes represent circRNA, square nodes represent mRNA, and diamond nodes represent lncRNA.
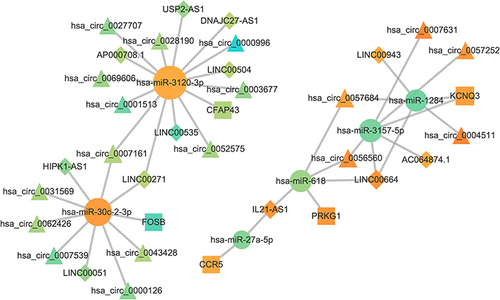
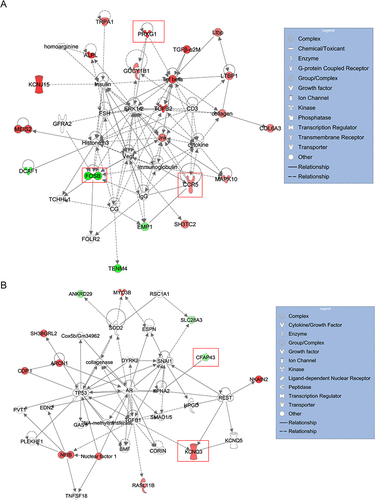
Figure 6 The gene interaction network of the characteristic genes predicted by IPA. (A) The gene interaction network of CCR5, FOSB and PRKG1. (B) The gene interaction network of CFAP43 and KCNQ3. Red indicated the up-regulated DEmRNA, green indicated the down-regulated DEmRNA, and colorless indicated the predicted component. The five characteristic genes were marked with red boxes.
Data Sharing Statement
The data that support the findings of this study are available on request from the corresponding author.