Figures & data
Table 1 Demographic Data of the Subjects (n = 136)
Table 2 FeNO Levels and Asthma Control at Baseline Visit
Table 3 Changes in Asthma Control and FeNO Levels Over Time
Figure 1 Boxplot of change in FeNO levels at 4, 8 and 12 months compared with baseline (all subjects). (A) Global Initiative of Asthma level of asthma control (GINA), (B) Asthma Control Test (ACT), (C) Asthma Control Questionnaire (ACQ). Changes in FeNO levels were presented as observed FeNO at certain time point minus baseline level (ppb). p value was calculated by Kruskal–Wallis test. * = p < 0.05. The solid line represents the median level, the box represents the IQR and the upper / lower whiskers are from the upper/lower quartile to the highest/lowest actual value within the 75th percentile/25th percentile ± 1.5 × IQR. Changes in levels of control: Improved (improved in at least one level of asthma control, ie, from partly controlled or uncontrolled to control, or from uncontrolled to partly controlled), no change (stayed at same level of control), worsened (worsened in at least one level of asthma control, ie from controlled to partly controlled or uncontrolled, from controlled to partly controlled).
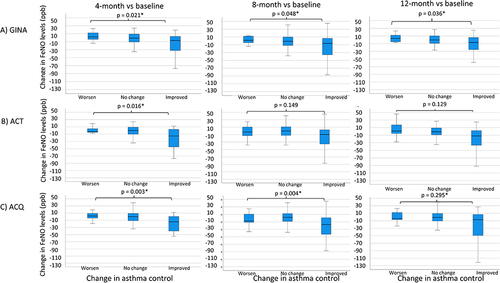
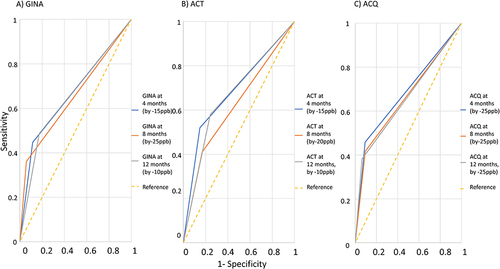
Figure 2 ROC curves for predicting the improvement for asthma control at different time points. (A) Global Initiative of Asthma level of asthma control (GINA), (B) Asthma Control Test (ACT), (C) Asthma Control Questionnaire (ACQ).