
Figures & data
Table 1 Characteristics of Healthy Controls and Asthma Patients (EOA vs LOA)
Figure 1 mRNA expression levels in eosinophils stimulated using IL-5 or IL17 for 30 min, 1 hour, or 3 hours: (A) Integrin α4; (B) Integrin β2; (C) CCR3; and (D) CCR5.
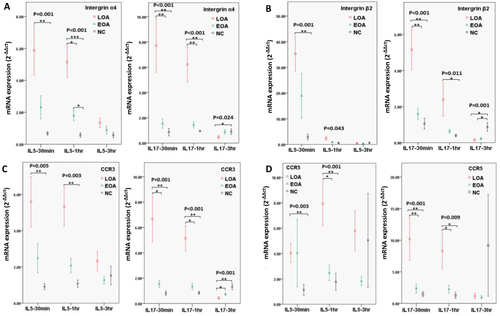
Figure 2 mRNA expression levels in eosinophils stimulated using IL-5 or IL17 for 30 min, 1 hour, or 3 hours: (A) IL-5Rα; (B) IL-17RA; (C) IL-4Rα; (D) CRTH2; and E. FcεRI.
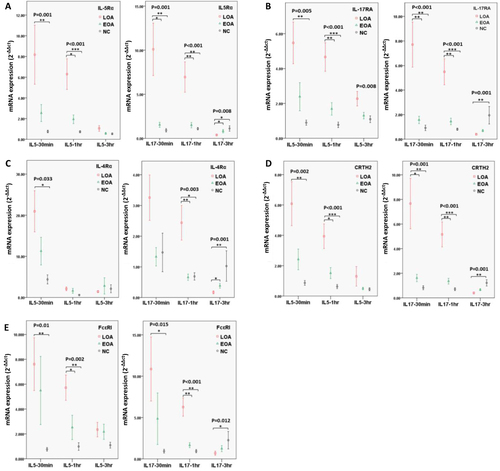
Figure 3 mRNA expression levels in eosinophils stimulated using IL-5 or IL17 for 30 min, 1 hour, or 3 hours: (A) TGF-β1; (B) AHR; (C) TLR-3; (D) TLR-7; and (E) TLR-9.
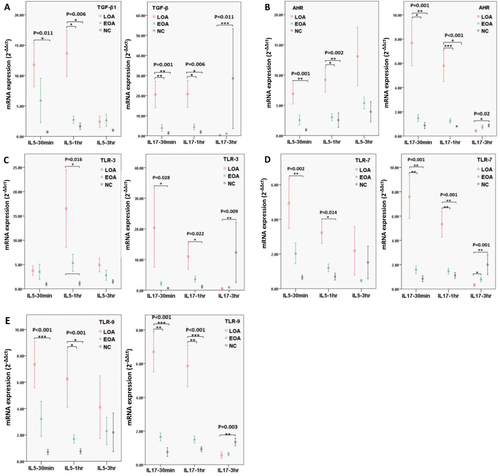
Table 2 Summary of Effects of IL-5 and IL-17 Stimulation on mRNA Expression in Eosinophils of EOA and LOA Patients and Normal Control Subjects
Figure 4 mRNA expression of specific genes in eosinophils as a function of atopy or obesity. (A) The expression of integrin β2 after IL-5 or IL-17 stimulation (1-hour) and CRTH2 and FcεRI after IL-17 stimulation (1-hour) were higher in EOA patients with atopy than in EOA patients without atopy; (B) The expression of integrins α4, CCR3, IL-5Rα, IL-17RA, CRTH2, AHR and TLR-7 after of IL-17 stimulation (30 min) were higher in obese EOA patients than in non-obese EOA patients; (C) The expression of IL-17RA and TGF--β1 after of IL-17 stimulation (1-hour) was higher in obese LOA patients than in non-obese LOA patients.
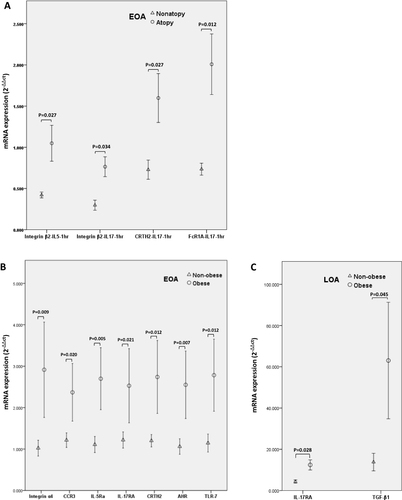
Table 3 mRNA Expression of Activated Eosinophil Correlation with T2 Markers in Patients with EOA and LOA
Figure 5 Continued.
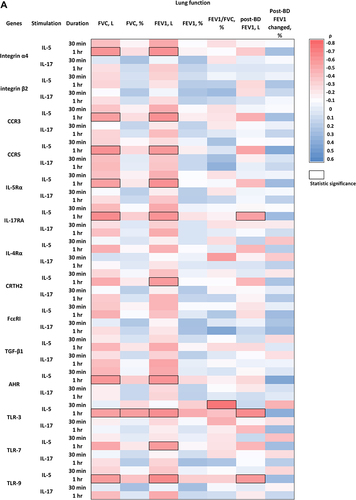
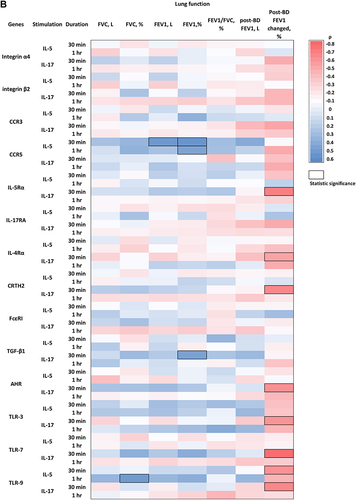
Figure 5 Heatmap showing the Spearman correlation coefficient ρ of mRNA expression levels and lung function parameters (A) LOA group; (B) EOA group. Red and blue color respectively indicate negative and positive correlations. The thick black frame indicates that the correlation is statistic significant.
Data Sharing Statement
The datasets used and/or analyzed during the current study are available in the Google drive repository.
[https://drive.google.com/drive/folders/13DXdwj91b2qG4WL9LLTezFFYSNxdsj7a?usp=sharing].