
Figures & data
Figure 1 GINA-2014 guidelines.
Abbreviations: ICS, inhaled corticosteroids; OCS, oral corticosteroids; LTRA, leukotriene receptor antagonists; LABA, long-actingbeta2-agonist; SABA, short-actingbeta2-agonist; IgE, immunoglobulin E.
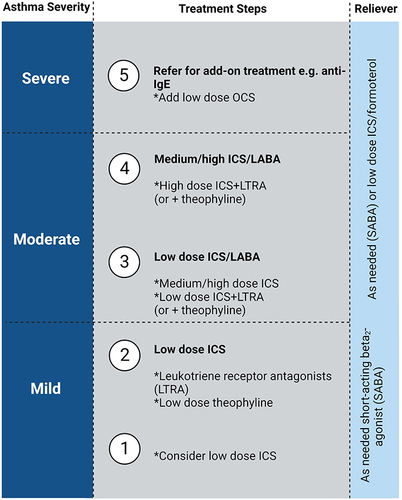
Figure 2 Design of the study.
Abbreviations: N-ERD G, nonsteroidal anti-inflammatory drugs-exacerbated respiratory disease group; AG, asthma group; NSAID, non-steroidal anti-inflammatory drugs; FVC, forced vital capacity; FEV1, forced expiratory volume in the first second; REV, reversibility; OCS, oral corticosteroids; LTRA, leukotriene receptor antagonists; SABA, short-actingbeta2-agonist; IgE, immunoglobulin E.
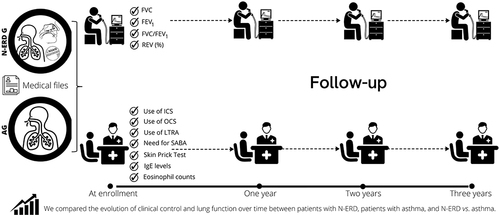
Table 1 Demographic Data
Table 2 Comparison Between the N-ERD Group and the AG
Table 3 Comparison Between the N-ERD Group
Table 4 Logistic Regression in N-ERD Group
Figure 3 Forced Expiratory Volume in the First Second (FEV1) in N-ERD and Asthma groups. *Indicates p-value <0.05.
Abbreviations: AG, Asthma group; N-ERD, Nonsteroidal anti-inflammatory drug-exacerbated respiratory disease.
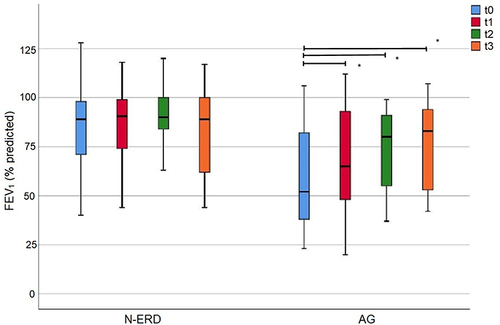
Figure 4 Frequency of good clinical control of asthma and high doses of inhaled corticosteroids in N-ERD and asthma groups. Basal time (t0), 12 months-time 1 (t1), 2 years-time 2 (t2), and 3 years-time 3 (t3). *Indicates p-value <0.05.
Abbreviations: AG, Asthma group (RED); N-ERD, Nonsteroidal anti-inflammatory drug-exacerbated respiratory disease (BLUE).
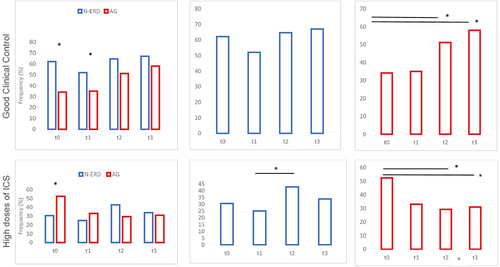
Figure 5 N-ERD patients in step 4 of the GINA 2014 guidelines.
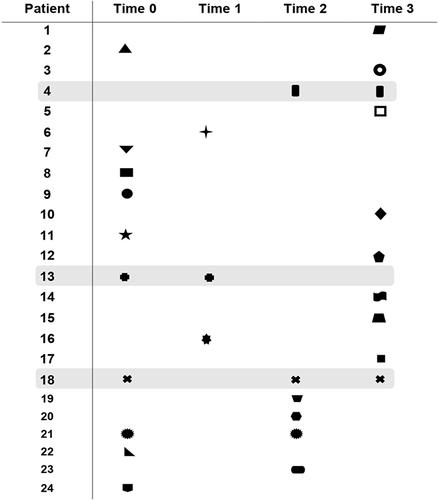
Table 5 Comparison Between the AG