Figures & data
Table 1 Baseline Demographics and SCS Use During the Treatment Period
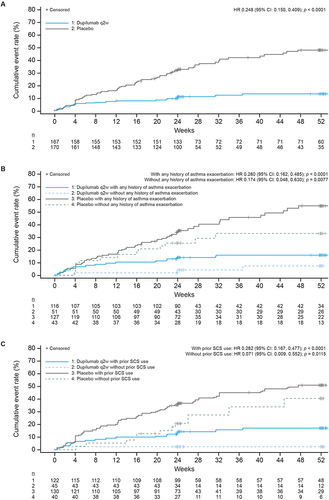
Figure 1 Kaplan–Meier plot of time to first use of SCS during the treatment period in patients with CRSwNP and coexisting asthma (A) overall and (B) by history of asthma exacerbationa or (C) prior SCS use.
Notes: aAsthma exacerbation was defined as an exacerbation requiring SCS or hospitalization (>24 hours) for treatment of asthma and was determined using medical records. All p-values are nominal.
Abbreviations: CI, confidence interval; CRSwNP, chronic rhinosinusitis with nasal polyps; HR, hazard ratio; q2w, every 2 weeks; SCS, systemic corticosteroids.