Figures & data
Table 1 Characteristics of Asthmatic Subjects
Table 2 Summary of Asthma Control-Related Parameters
Figure 1 Relationship between sputum NRTN levels and serum NRTN levels in asthmatic subjects (n = 15). Open circles indicate levels below the lower limit of the measurement range.
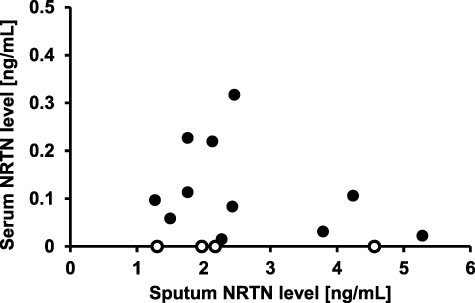
Table 3 Summary of Sputum Analyses Data
Figure 2 Comparisons of sputum NRTN levels between asthmatic subjects by atopic status (A), by different asthma severities (B), by asthma control status (C), with or without a fixed airflow obstruction (D), with or without asthma exacerbations with unscheduled visits the outpatient clinic in the previous year (E), and with or without asthma exacerbations with occasional uses of systemic corticosteroids in the previous year (F). The box signifies the 25th and 75th percentiles, and the median is represented by a short line within the box. The open circle indicates sputum NRTN level in asthmatic subjects. *p < 0.05.
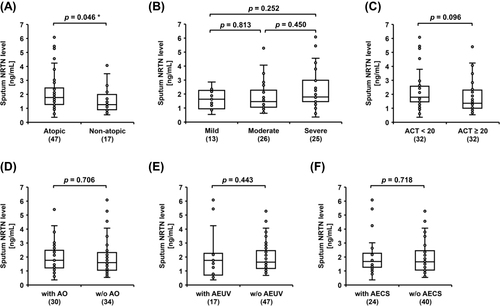
Figure 3 Relationships between sputum NRTN level and FeNO level (A), ACT score (B), and % predicted FEV1 (C). A comparison of sputum NRTN levels between asthmatic subjects with FeNO < 20 ppb and those with FeNO ≥ 20 ppb (D). The result of linear regression analysis of the data that reveal a significant correlation is represented by the solid line. The box signifies the 25th and 75th percentiles, and the median is represented by a short line within the box. The open circle indicates sputum NRTN level in asthmatic subjects.
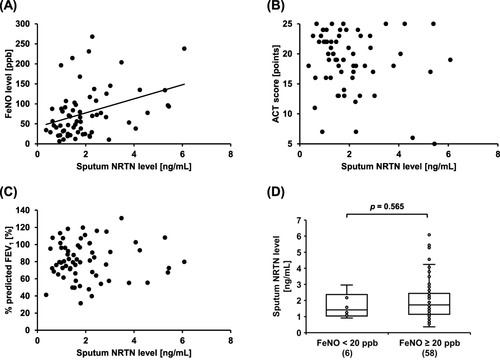
Figure 4 Receiver operating characteristic (ROC) analysis of sputum NRTN level and FeNO as predictors of sputum eosinophilia (eosinophils ≥ 2%). The area under the curves of sputum NRTN and FeNO were 0.578 and 0.945, respectively.
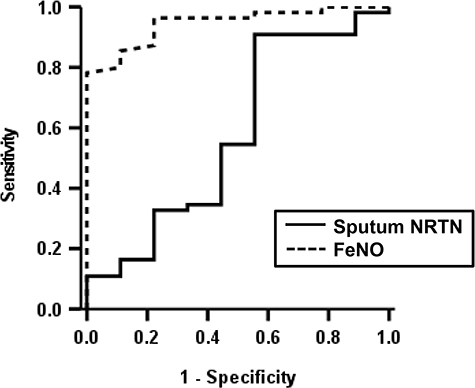
Figure 5 Correlations between sputum NRTN level and sputum eosinophils (A), sputum neutrophils (B), sputum macrophages (C), and sputum lymphocytes (D) in asthmatic subjects.
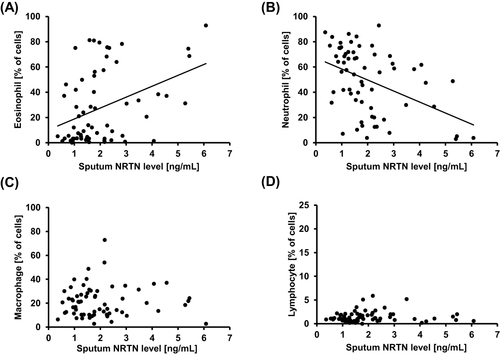
Figure 6 Comparisons of sputum NRTN levels between asthmatic subjects by airway inflammatory phenotypes. *p < 0.05.
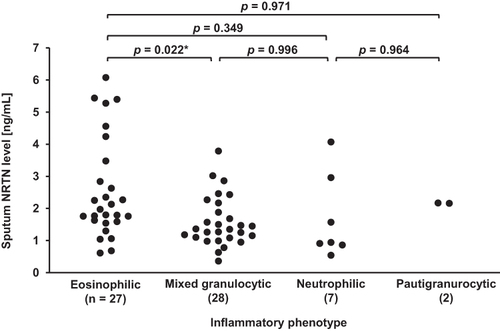
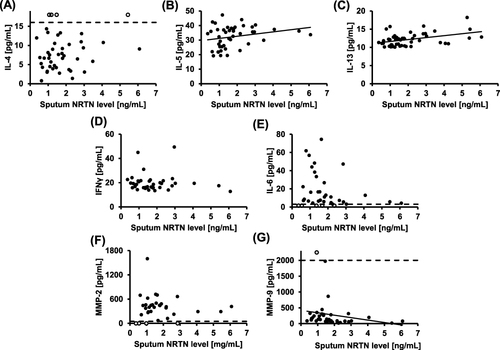
Figure 7 Correlations between sputum NRTN level and IL-4 (A), IL-5 (B), IL-13 (C), IFN-γ (D), IL-6 (E), MMP-2 (F), and MMP-9 (G) levels in sputum supernatant. The results of linear regression analysis of the data that reveal significant correlations are represented by the solid line. Dashed lines indicate the limit of each measurement, and open circles indicate levels outside the measurement range.