Figures & data
Table 1 Characteristics of the AR Patients and Healthy Controls
Table 2 Basic Information of the SNPs in TLR1 Gene
Table 3 Associations Between TLR1 Polymorphisms and AR Susceptibility
Figure 1 Positive results about TLR1-rs72493538 and -rs76600635 found in stratified analysis are shown in forest map.
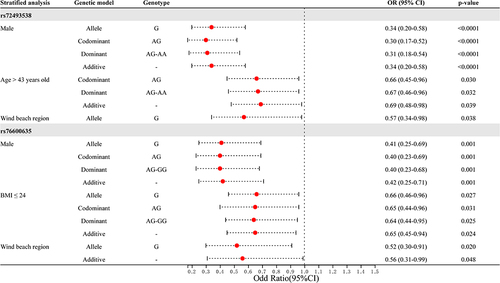
Table 4 SNP-SNP Interactions of TLR1 Gene Analyzed by MDR Method
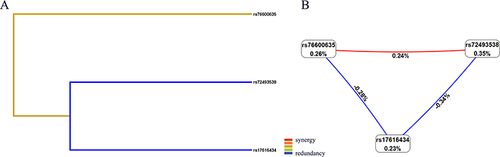
Figure 2 Multifactor dimensionality reduction (MDR) analysis of interaction between the four SNPs of TLR1 (rs72493538, rs76600635, and rs17616434). (A) The color represents the degree of redundancy or synergy between SNP-SNP; the closer the color is to red, the more synergy, and the closer to blue, the more redundancy; (B) The Fruchterman-Region of SNP-SNP interactions. Each SNP is reported in per cent the value of Information Gain (IG), while numbers in the connections indicate the entropy-based IG for the SNP pairs. Red bar indicates high-level synergies on the phenotype, while blue connections with negative IG values indicate redundancy or lack of synergistic interactions between the markers.