Figures & data
Figure 1 The geographical location of hospitals (red circles denote public hospitals) and air quality monitoring stations (blue circles denote air quality monitoring station) in Shijiazhuang.
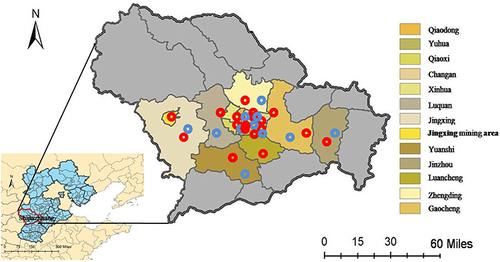
Table 1 Descriptive Statistics on Asthma Cases, Air Pollutants, Meteorological Factors in Shijiazhuang During 2010–2016
Figure 2 The time-series distributions of the daily asthma exacerbation cases and O3 in Shijiazhuang, China from 2010 to 2016.
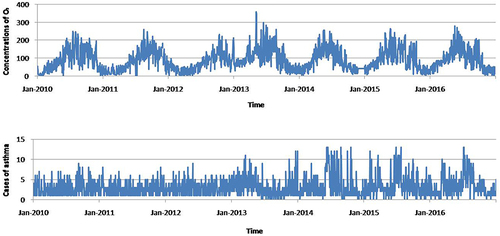
Figure 3 Coefficients of Spearman correlation between asthma exacerbation cases and air pollutants and meteorological factors in Shijiazhuang, China from 2010 to 2016. (Y-axis: the cases of asthma, concentration of pollution, relative humidity and temperature. X-axis: the same with the Y-axis).
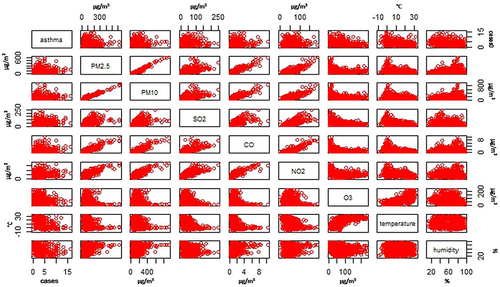
Figure 4 Relationship between air pollutants, meteorological variables and asthma exacerbation cases (Y-axis: the predicted value of asthma cases as the independent variables changed. X-axis: the distribution of variables (including ozone, other air pollutants, temperature, humidity and time) in the asthma patients).
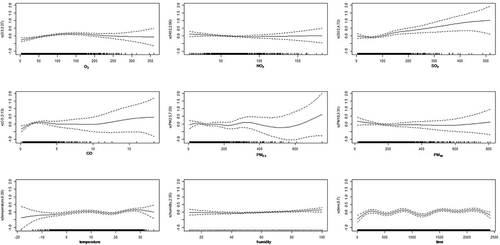
Table 2 Relative Risks with 95% CI of Asthma Exacerbations in Shijiazhuang During 2010–2016 Based on 10 μg/m3 Increases in the Fine Particulate Matter (O3) Concentration
Figure 5 The interaction of O3 and SO2, NO2, temperature as well as relative humidity on asthma exacerbation cases at present day in Shijiazhuang, China from 2010 to 2016, the interaction of O3 with SO2 (top left); the interaction of O3 with NO2 (top right); the interaction of O3 with temperature (bottom left); the interaction of O3 with relative humidity (top right).
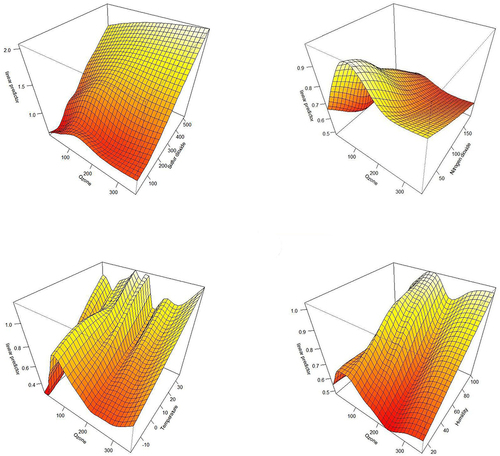
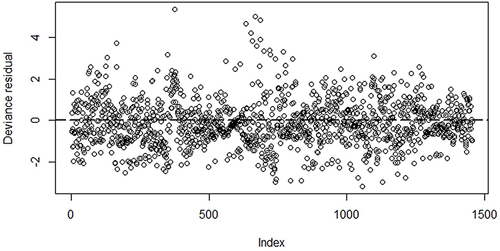
Figure 6 The result of model diagnostic of PDLM on 14-day lag.