Figures & data
Figure 1 Presents the trends of per-hospital asthma-related ED visits (the blue bars), per-clinic asthma-related non-urgent polyclinic visits (the grey bars), per-clinic asthma-related urgent polyclinic visits (the orange bars) and the PRR (the solid black line) between January 2019 and October 2020.
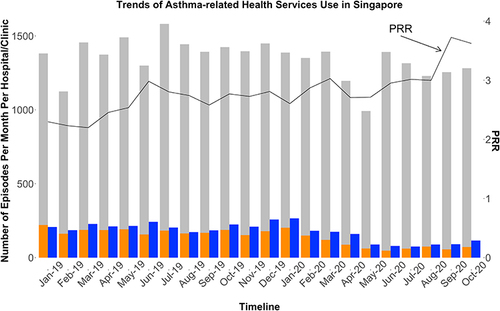
Figure 2 Presents the trends of per-clinic preventer and reliever dispensations (the dashed lines) and the PRR (the solid line) between January 2019 and October 2020.
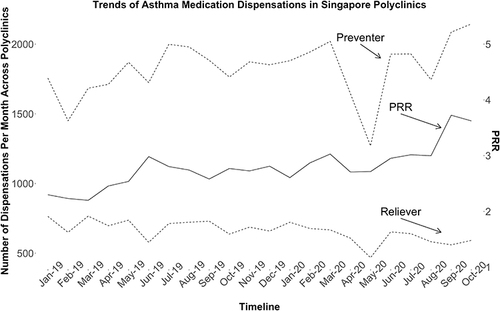
Figure 3 Presents the marginal mean estimates of overall asthma-related polyclinic visits (number of episodes per clinic per month), asthma-related urgent polyclinic visits (number of episodes per clinic per month), and asthma-related ED visits (number of episodes per hospital per month) across different COVID-19 stages and PRR levels.
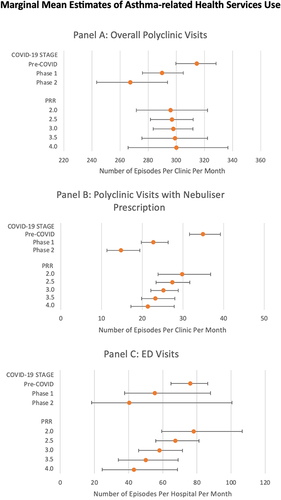
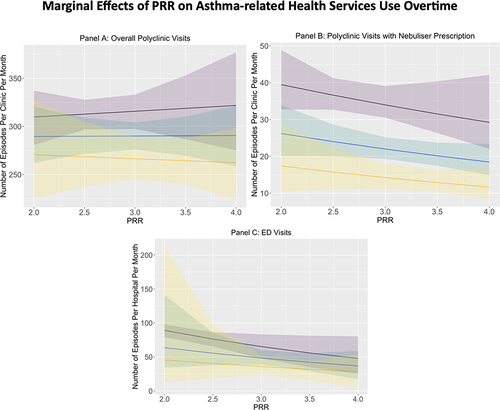
Figure 4 Presents the marginal effects of the ratio of PRR on overall asthma-related polyclinic visits (number of episodes per clinic per month), asthma-related urgent polyclinic visits (number of episodes per clinic per month) and asthma-related ED visits (number of episodes per hospital per month) by COVID-19 Stage. For each panel, the black line with purple confidence band, the blue line with blue confidence band, and the yellow line with yellow confidence band each represent the adjusted mean estimates and the 95% confidence interval during Pre-COVID, Phase 1 and Phase 2 respectively.