Figures & data
Table 1 Demographic Characteristics of Birch Pollen Allergy Subjects Between PFAS and Non-PFAS Group
Figure 1 Sensitization rates (%) and sIgE levels (kUA/L) of various allergen components of birch pollen.
Notes: (A) sIgE levels of birch allergen components. Bet v 1 had the highest levels among the four components. Sensitization rate of different birch pollen allergen components with Bet v1 as the major component (82.8%), followed by Bet v 2 (29.3%); (B) The correlation among birch pollen allergen and different allergen components; Bet v 1 sIgE level was positively correlated. ***p < 0.001; (C) Birch allergen component sensitization pattern. 63.8% were mono-sensitized to Bet v 1, 10.3% were mono-sensitized to Bet v 2, 19.0% were both sensitized to Bet v 1 and Bet v 2. Only 1 patient (1.7%) was positive to Bet v 6; (D) Venn diagram of different allergen components.
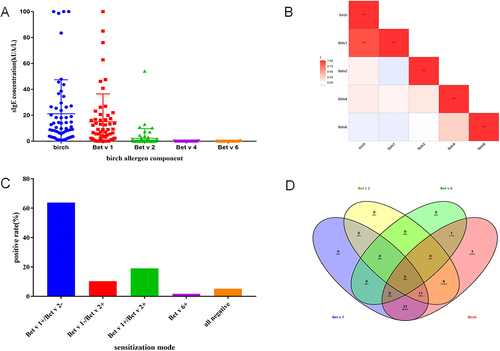
Figure 2 Differences of sIgE levels of birch pollen and its allergen components in participants with food allergy and those not.
Notes: (A) comparison of sIgE levels of birch pollen, Bet v 1, Bet v 2 between PFAS and non-PFAS group. (B) comparison of sIgE levels of birch pollen, Bet v 1, Bet v 2 between AA and non-AA group.
Abbreviations: PFAS, pollen food allergy syndrome; AA, apple allergy.
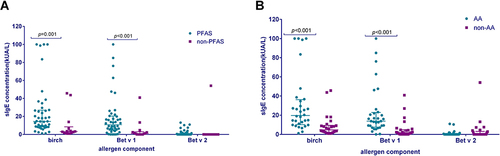
Figure 3 The results of the ROC analysis indicate that birch pollen allergen components can serve as reliable predictors for PFAS and apple allergy.
Notes: The diagnostic value of allergen components with PFAS (A) and apple allergy (B).
Abbreviation: ROC, receiver operating curve.
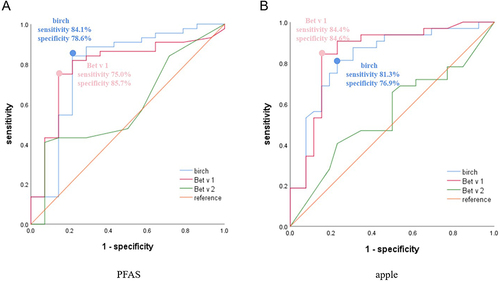
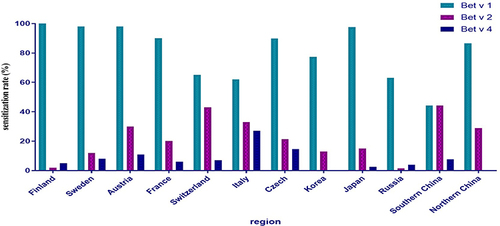
Figure 4 Regional variations in sensitization rates to birch allergen components.