Figures & data
Table 1 Comparison of Clinical Characteristics Between Difficult and Mild Asthma Cohorts
Table 2 Comparison of Asthma Morbidity Between Difficult and Mild Asthma Cohorts
Figure 1 Lung function characteristics between the difficult and mild asthma cohorts. Post-BD spirometry values shown for difficult asthma and pre-BD spirometry values shown for mild asthma. (A) Clinic FEV1% predicted., (B) Clinic FVC % predicted, (C) Clinic FEV1/FVC ratio %, (D) Clinic FEF25-75% % predicted. Data presented as median ± interquartile range. ****P <0.0001. A full breakdown of the results and statistics is available in Table S4.
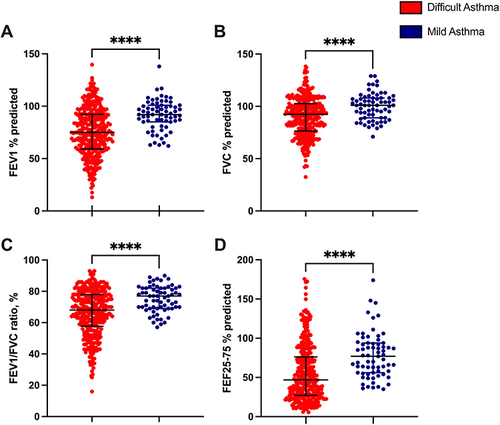
Table 3 Comparison of T2 Biomarkers and Inflammometry Between Difficult and Mild Asthma Cohorts
Figure 2 Comparison of physician and/or clinically diagnosed comorbidity characteristics between the difficult and mild asthma cohorts. Comorbidities are represented as percentages (%). Fisher’s exact test was applied for categorical variables. *P <0.05, **P <0.01, ***P <0.001, ****P <0.0001. A full breakdown of the results and statistics is available in Table S7.
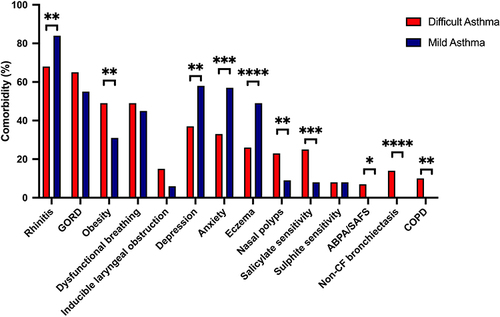
Table 4 Comparison of Asthma and Comorbidity-Related Questionnaire Characteristics Between Difficult and Mild Asthma Cohorts
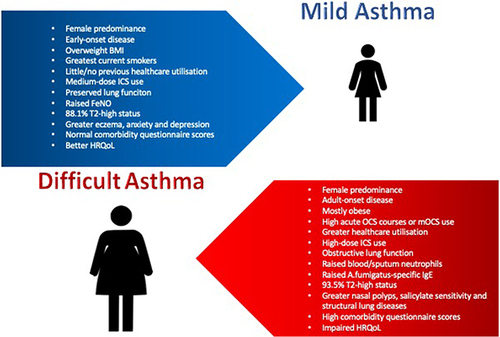
Figure 3 Summary of mild and difficult asthma phenotypes. Early-onset <18 years, Adult onset ≥18 years.