Figures & data
Table 1 Socio-Demographic and Clinical Characteristics of Naïve and Bio-Experienced Patients, Including Omalizumab and Mepolizumab Subsets, Collected Before Initiating Benralizumab Treatment
Table 2 Proportion of Patients Free from Severe Exacerbations Before and During Benralizumab Treatment in Naïve, Bio-Experienced, Omalizumab, and Mepolizumab Groups
Figure 1 AER reduction during benralizumab treatment in naïve, bio-experienced, omalizumab, and mepolizumab groups. Any (A) and severe (B) AER are shown at index date and after 48 and 96 weeks of treatment with benralizumab.
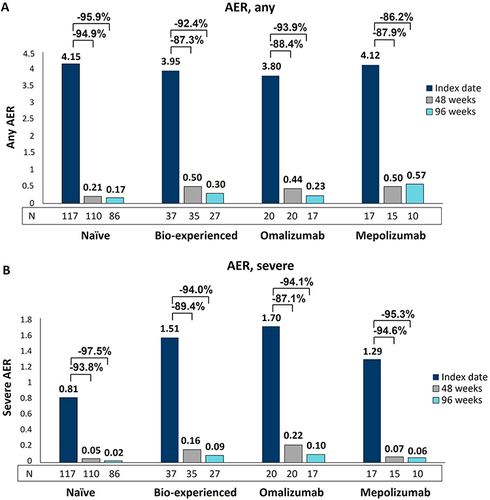
Figure 2 Change in pre-BD respiratory parameters during benralizumab treatment in naïve, bio-experienced, omalizumab, and mepolizumab groups. Median pre-BD FEV1 (A) and pre-BD FVC (B) are shown at various time points (index date and 4, 16, 24, 48, and 96 weeks of treatment with benralizumab).
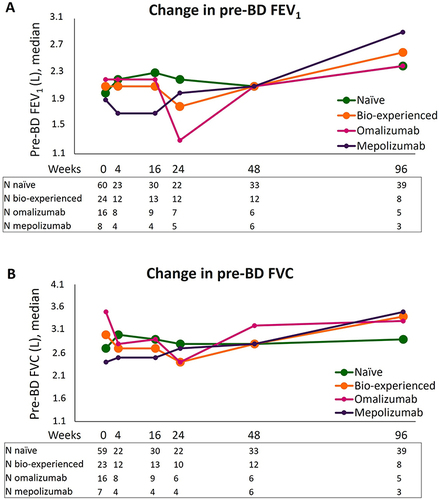
Figure 3 Long-term OCS reduction during benralizumab treatment in naïve, bio-experienced, omalizumab, and mepolizumab groups. OCS daily dose (mg of prednisone equivalent), expressed as median (IQR), is shown at index date and after 48 and 96 weeks of treatment with benralizumab.
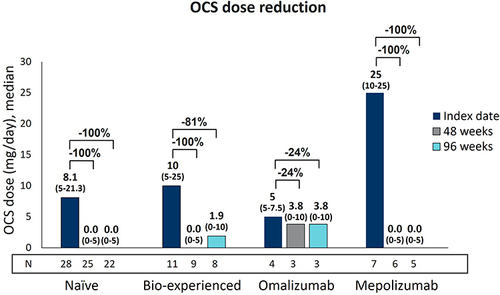
Table 3 Proportion of Patients Achieving OCS Dose Reduction and/or Interruption During Benralizumab Treatment in Naïve, Bio-Experienced, Omalizumab, and Mepolizumab Groups After 48 and 96 Weeks
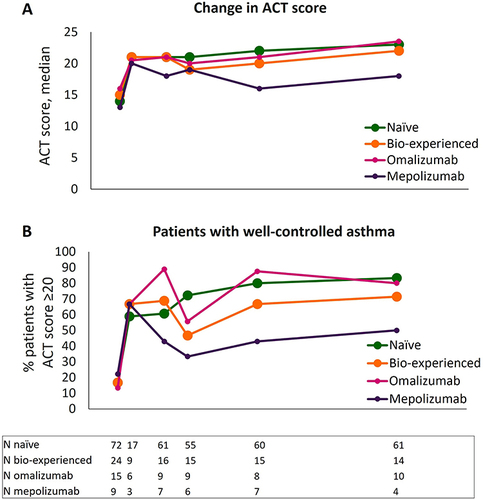
Figure 4 Improvement in asthma control during benralizumab treatment in naïve, bio-experienced, omalizumab, and mepolizumab groups. Median change in ACT score (A) and percentage of patients achieving a well-controlled asthma (ACT score ≥20) (B) are shown at various time points (index date and 4, 16, 24, 48, and 96 weeks of treatment with benralizumab).