Figures & data
Table 1 Characteristics of the Enrolled Patients Stratified According to the Asthma Phenotype
Figure 1 Flowchart of the study population. n = number.
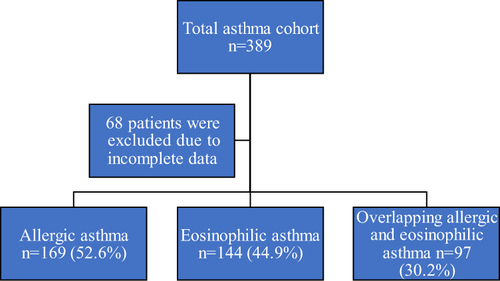
Table 2 Asthma Severity Among the Enrolled Patients Stratified by Asthma Phenotypes
Figure 2 Boxplot showing pulmonary Lung function (spirometry assessment) results in 57 patients. The boxes represent the upper and lower quartiles. The line dividing each box is the median value.
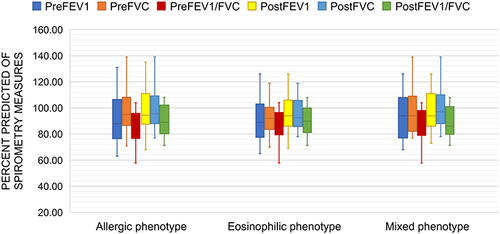
Table 3 Factors Associated with Uncontrolled Asthma
Table 4 Logistic Regression Showing Unadjusted and Adjusted Odds Ratios for Patients with Uncontrolled Asthma
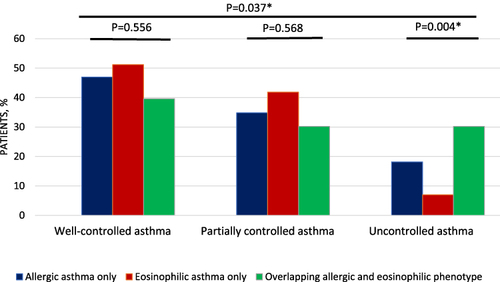
Figure 3 Prevalence of asthma control according to the Global Initiative for Asthma (GINA) asthma control guideline in the enrolled patients, stratified by the asthma phenotypes (allergic, eosinophilic, and overlapping allergic and eosinophilic phenotypes). *p ≤ 0.05.