
Figures & data
Table 1 The Comparison of Baseline Information Between Asthma and Control Groups
Figure 1 The comparison of SPC values between the asthma group and the control group.
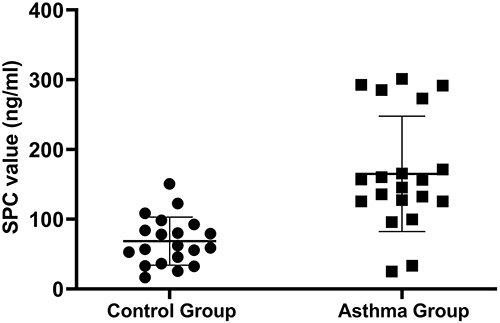
Table 2 FeNO Values, Lung Function Test Results, and C-ACT Scores of 20 Children in the Asthma Group and Their Correlations with SPC Values
Table 3 Factors Independently Associated with FeNO Value, Lung Function Test Results, and C-ACT Score