Figures & data
Table 1 Basic Clinical Data of Bronchial Asthma in Acute Attack and Non-Acute Stages [x±s, Cases (%)]
Figure 1 ROI delineation with the LK software. (A–C) shows the LK software’s ROI delineation in the coronal, transverse, and sagittal views of the patient’s CT image respectively.
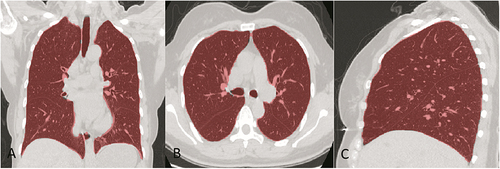
Figure 2 Adiomics flow chart. It includes 5 steps: (a) Acquisition of CT images. (b) Delineation of image ROI. (c) Extraction of omics features. (d) Selection of omics features. (e) Evaluation of models.
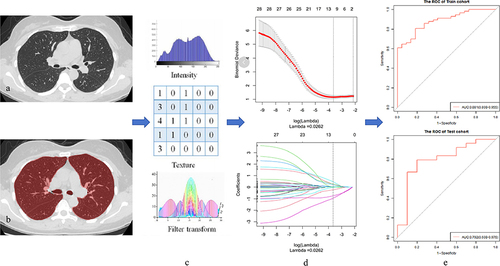
Table 2 Features Included in the Multi-Factor Logistic Regression Model and Corresponding Coefficients
Figure 3 Feature selection of LASSO regression. It was done by adjusting different hyperparameters (λ) to minimize the binomial deviation of the model, thereby achieving the purpose of screening optimal features. For each λ value, we can get a confidence interval of the target parameter around the mean value of the target parameter shown in the red dot. The two vertical dotted lines on the right indicate two special λ values: the minimum λ and the λ within one standard error. In this study, we use the minimum λ to find the factor, and the λ value is 0.0262; top of the picture is the number of included features.
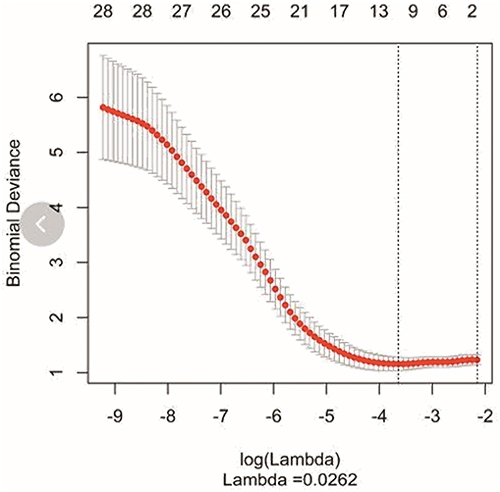
Figure 4 Selection of optimal imaging omics features. Each curve in the figure represents the change trajectory of each independent variable coefficient. The ordinate is the value of the coefficient, the lower abscissa is log (λ), and the upper abscissa is the number of non-zero coefficients in the model at this time.
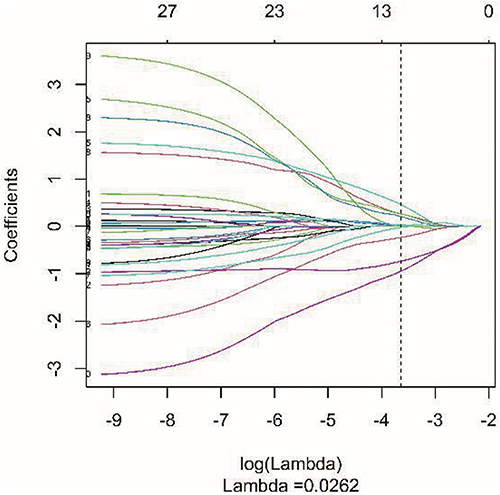
Figure 5 Radiomics nomogram. A radiomics nomogram was compiled based on selected radiomics features.
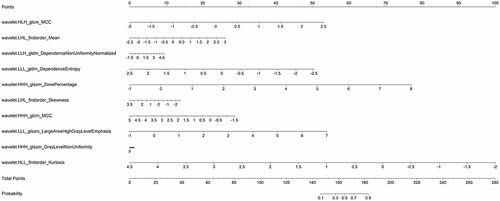
Table 3 Results of the Logistic Regression Model for Predicting Bronchial Asthma Stage
Figure 6 ROC curves of the radiomics model. (A). ROC curve of the radiomics model of the training group: AUC value is 0.881. (B). ROC curve of the radiomics model of the test group: AUC value is 0.792.
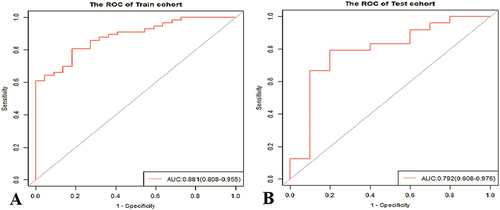
Figure 7 Diagnostic situation diagram. Diagnostic situation diagram of the test group (34 cases): the results of the diagnostic model depend on the data of the test group.
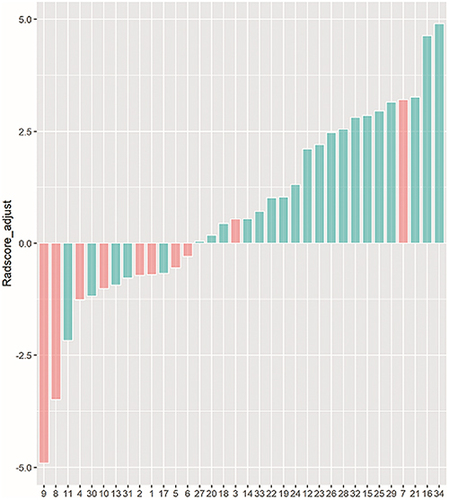
Figure 8 Calibration curves of the radiomics model. (A) and (B) are the calibration curves of the training group and the test group in the radiomics model respectively. (the x-axis represents the prediction of the nomogram, the y-axis represents the actual situation of bronchial asthma staging, the dotted line shows the ideal nomogram, and the solid line represents the performance of nomograms for the test group.).
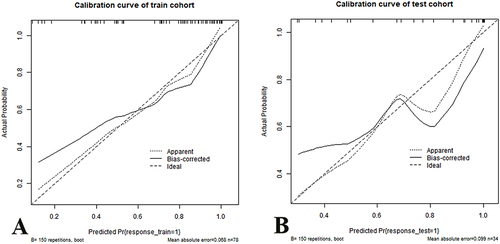
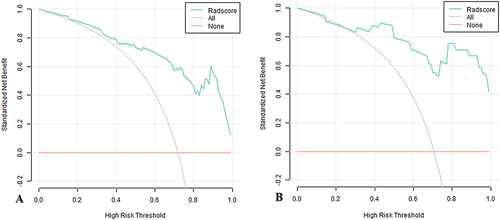
Figure 9 Decision curves of the radiomics model. (A) and (B) are the decision curves of the radiomics model of the training group and the test group respectively. (the light solid line in the above figure represents that all patients can benefit from the model, the solid horizontal line represents that all patients cannot benefit, and the discontinuous curve above the two curves represents the decision curve of the model we constructed. The interval between this curve and the light solid line and the horizontal solid line is called the net benefit area.).