
Figures & data
Table 1 Demographic Characteristics of the Study Subjects
Figure 1 Coexisting allergy between seafood species among participants with convincing allergy. In each cell, the correlation of subjects who were allergic to each column had comorbid allergy to each row, and in reverse. Correlation was calculated by Pearson correlation coefficient. *P<0.05, **P<0.01.
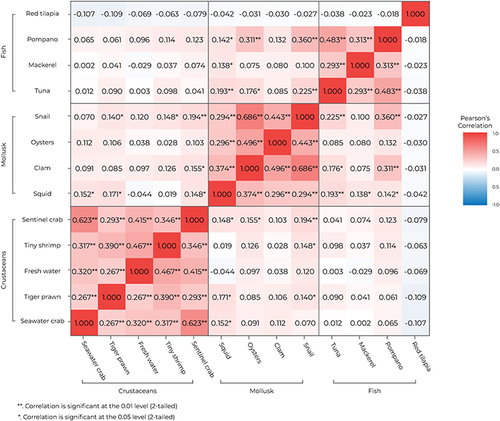
Table 2 History of Comorbid Allergic Diseases Among Subjects with Convincing Allergy
Figure 2 (A) Age of onset of SFA symptoms and (B) age of first introduction of shellfish/fish among convincing allergy subjects. The percentage of subjects who had persistent reactions after (C) shellfish or (D) fish consumption. *P <0.05. P values were calculated by Pearson’s chi-square.
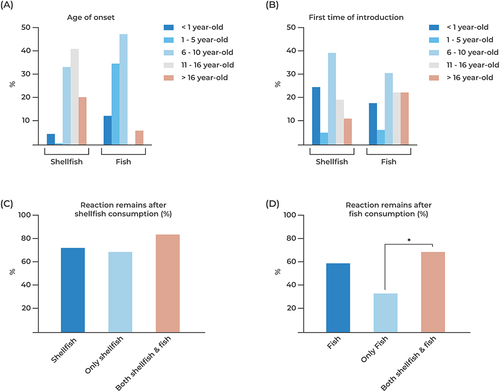
Table 3 Prevalence of Symptoms Among the Convincing Allergy Group
Table 4 Characteristics of Behavior Towards Seafood Allergy
Table 5 Multivariate Logistic Regression Analysis of Severe Allergy to Shellfish or Any Seafood