Figures & data
Table 1 Baseline Characteristics in Sweden and Norway, Among Participants with and without Asthma, and Among All
Table 2 10-Year Mortality and Attributable Mortality Risk Due to Asthma, Stratified by Educational Level and Among All
Figure 1 Mortality incidence curves among adults with asthma (red) compared to without asthma (black) and stratified by education.
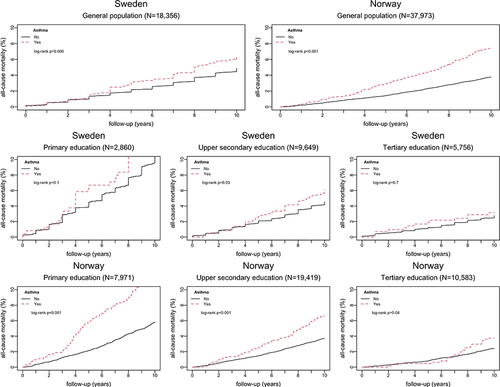
Figure 2 Asthma as a risk factor for 10-year mortality, among all participants and stratified by educational levels. Results are expressed as Hazard ratios with 95% Confidence intervals (CI) from crude Cox proportional hazard models, and from models adjusted for age, sex and smoking.
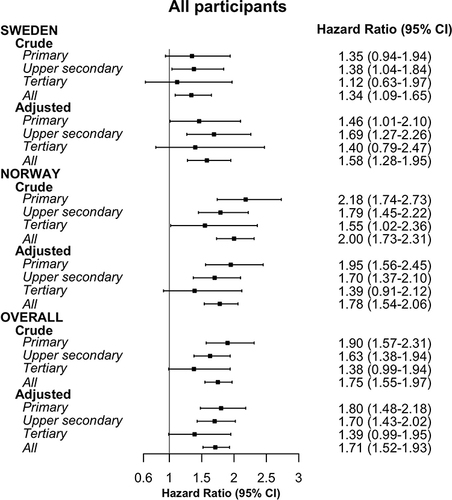
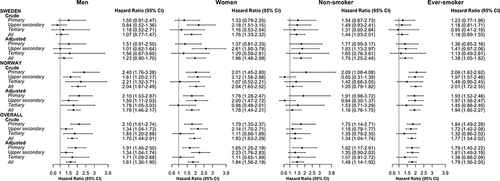
Figure 3 Asthma as a risk factor for 10-year mortality, among men, women, non-smokers, and ever-smokers, in all and stratified by educational levels. Results are expressed as Hazard ratios with 95% Confidence intervals (CI) from crude Cox proportional hazard models, and from models adjusted for age, sex and smoking.