Figures & data
Figure 1 Number of publications on CVA from 1993 to 2022.
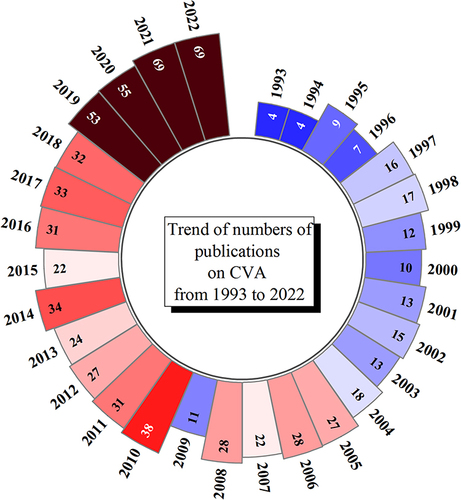
Figure 2 Trend of numbers of publications on CVA by years.
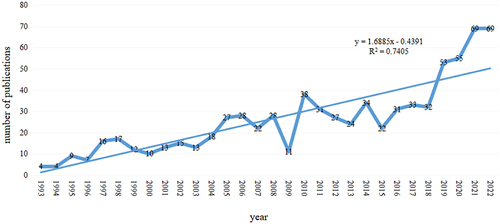
Table 1 The Count and Centrality Among Countries Involved in CVA
Table 2 The Count and Centrality Among Institutions Involved in CVA
Figure 3 Links and cooperation between countries by CiteSpace.
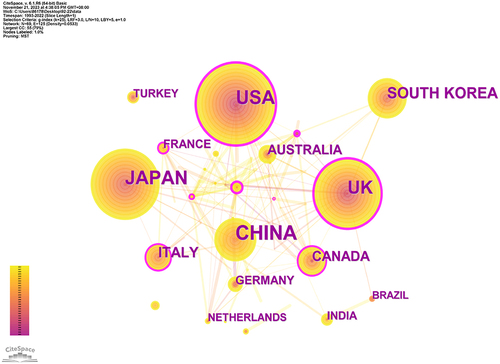
Figure 4 Geographical distribution and cooperation of global output by VOSviewer.
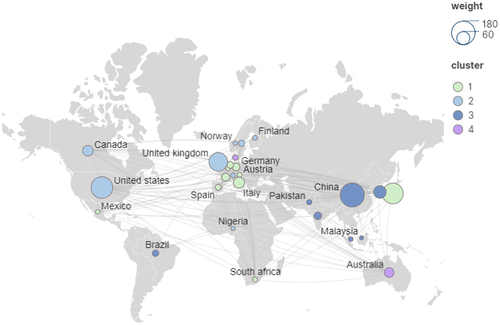
Figure 5 Number of articles and cooperation between different institutions by CiteSpace.
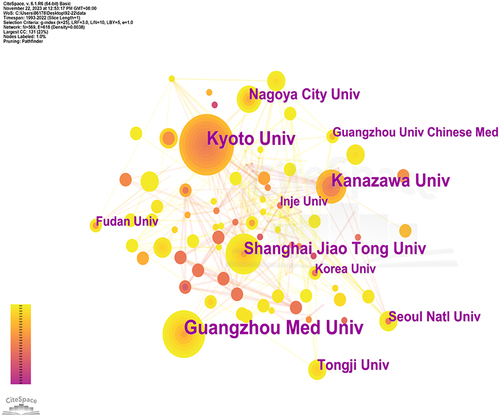
Figure 6 Contribution and cooperation of different institutions by chord chart.
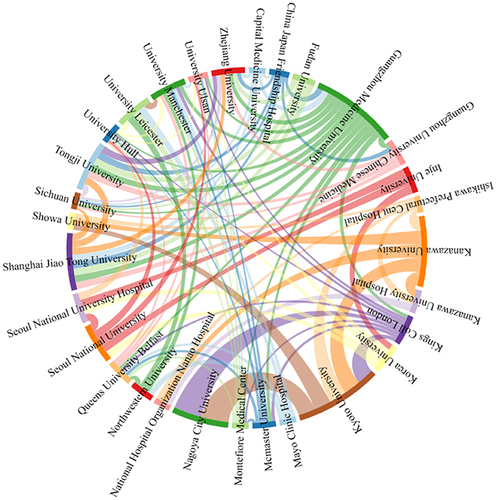
Table 3 Top 5 Most Active Authors in CVA from 1993 to 2022
Figure 7 The network on authors of CVA by VOSviewer.
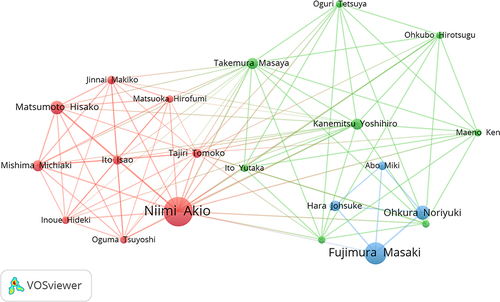
Table 4 Top 5 Most Active Co-Cited Authors in CVA from 1993 to 2022
Figure 8 Contribution and cooperation of different authors by VOSviewer.
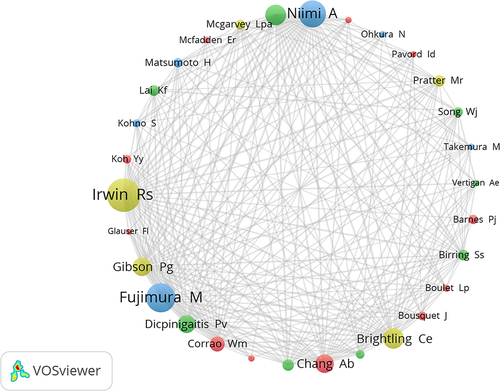
Table 5 Top 10 Most Active Journals in CVA from 1993 to 2022
Table 6 Top 10 Most Active Co-Cited Journals in CVA from 1993 to 2022
Figure 9 The weight of different publications in the density map.
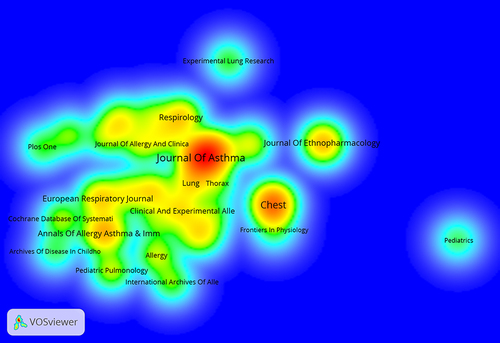
Figure 10 Network visualization map of journal co-citation analysis by VOSviewer.
Table 7 Top 20 Keywords with the Highest Frequency of Occurrence
Figure 11 Network on keywords of CVA by VOSviewer.
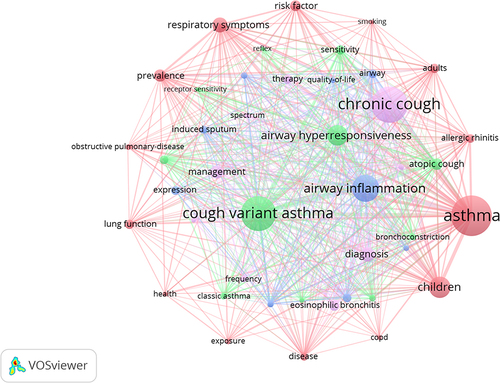
Figure 12 Cluster analysis of keywords by color differences.
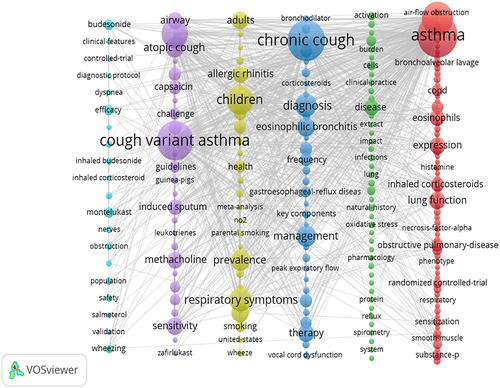
Figure 13 Top 20 representative burst keywords in CVA research by CiteSpace.
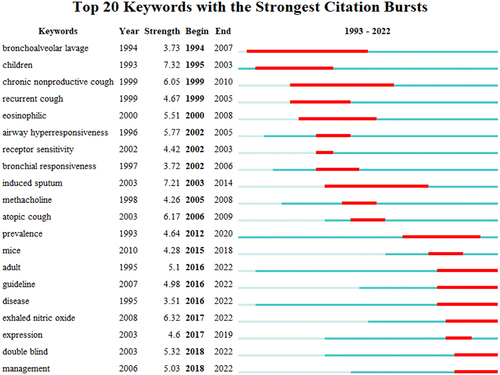
Table 8 22 Clusters Formed with the LLR Test Algorithm on Keywords by Citespace
Figure 14 Cluster analysis of the LLR test algorithm on keywords by CiteSpace.
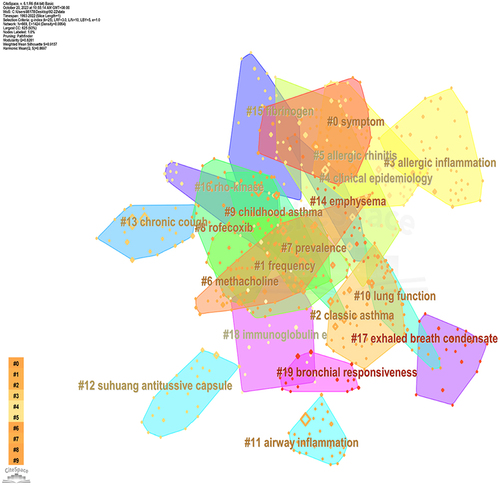
Table 9 The 10 Most Frequently Cited References Involved in CVA
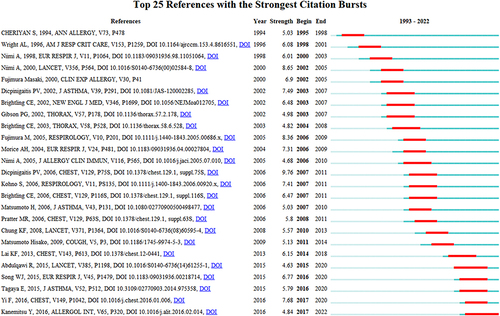
Figure 15 Top 25 most cited references based on the strength of the citation burst.