Figures & data
Table 1 Sociodemographic characteristics of patients according to asthma control at baseline
Figure 1 Asthma control improvement between visits.
Note: *P < 0.001, compared to rate of controlled asthma at the same visit; +P < 0.001 compared to visit 1.
Abbreviation: ACT, asthma control test.
Abbreviation: ACT, asthma control test.
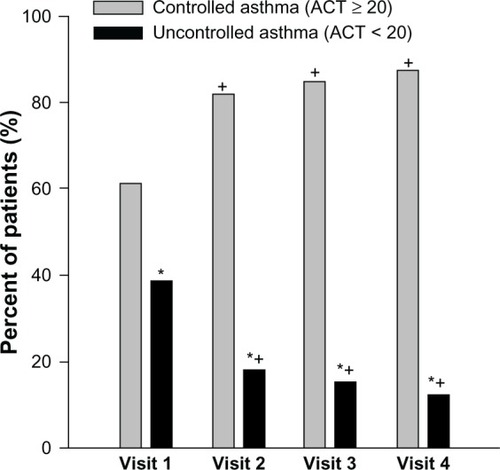
Table 2 Change in asthma control status from Visit 1–Visit 4 in terms of asthma duration, BMI, smoking status, and comorbid disorders
Figure 2 Change in percentage of uncontrolled asthma patients (n = 220) with fixed dose and seperate combination inhaler treatments from visit 1 to visit 4.
Abbreviations: FP/s, fluticasone propionate/salmeterol; BDP/F, beclomethasone/formoterol; B/F, budesonide/formoterol; B + F, budesonide + formoterol.
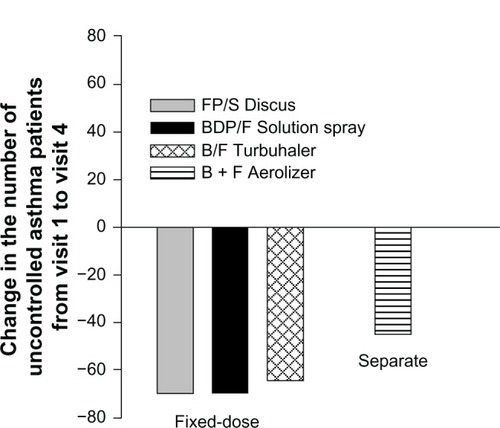
Table 3 Asthma control level according to inhaler device as assessed by the physicians
Table 4 Logistic regression analysis for predictors of asthma control