Figures & data
Table 1 Baseline Characteristics of the Study Population
Table 2 Baseline Characteristics of the Study Population and Kinetics of Parameters in Patients Treated with BT
Table 3 The Correlation Coefficients Between CT Findings and Baseline Characteristics
Figure 1 Change in parameters between before BT and one year after the third BT procedure. There was a significant decrease in the number of asthma exacerbations (A), unscheduled visits due to exacerbations (B), and ACQ6 score (C) after one year. There was a significant increase in the AQLQ score (D), along with a decrease in FeNO (E), FEV1% (F), √WA at Pi10 (G) after one year. There was no significant change in the mucus score (H) during the same period. The bars indicate the median values. *p < 0.05.
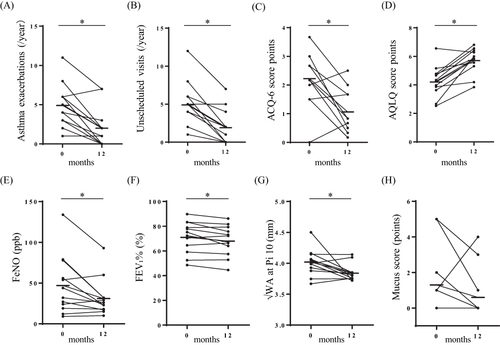
Table 4 The Correlation Coefficients Between Δ√WA at Pi 10 and Δmucus Score
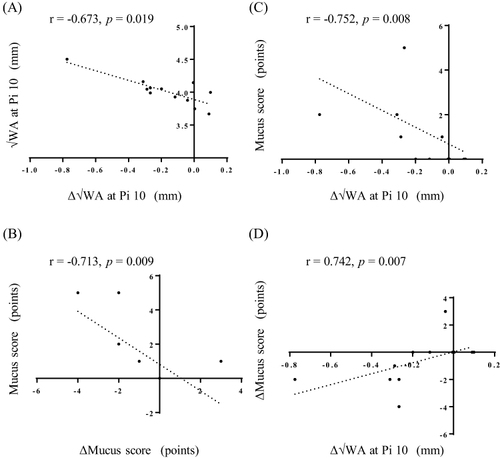
Figure 2 Correlation between √WA at Pi10 and mucus score. There were significant negative correlations between pre-BT values and changes from pre-BT values to those recorded one year after the third BT procedure in √WA at Pi10 (Δ√WA at Pi10) (A) and in the mucus score (ΔMucus score) (B), respectively. Δ√WA at Pi10 was negatively correlated with the baseline mucus score (C) and positively correlated with ΔMucus score (D).