
Figures & data
Figure 1 Schematic diagram of this study. 645,732 outpatients from January 2016 to December 2019 were enrolled from the First Affiliated Hospital of Xiamen University. Among these outpatients, 639,043 cases were excluded according to the exclusion criteria. 6689 outpatients were enrolled and clinical data/Skin Prick Test (SPT) results (eight common allergens) were collected and analysed. Subsequently, univariate analysis and multivariate analysis of distributional characteristics analysis of allergens in these patients were performed to illustrated the distributional characteristics of allergens in AR patients in Southern Fujian Province, China.
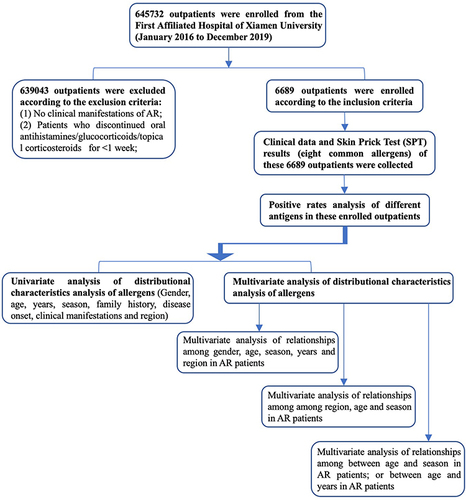
Table 1 Positive Rates and Distribution of Various Allergens in Skin Prick Test in Allergic Rhinitis Patients (n=6689)
Table 2 Different Allergen Positive Rates in Patients with Positive Skin Tests
Table 3 Univariate Analysis of Risk Factors in Patients with Positive Skin Tests
Table 4 Multivariate Analysis of Relationships Among Gender, Age, Season, Years and Region in AR Patients
Table 5 Multivariate Analysis of Relationships Among Region, Age and Season in AR Patients
Table 6 Multivariate Analysis of Relationships Between Age and Season in AR Patients
Data Sharing Statement
All data generated or analyzed during this study are included in this article. Further enquiries can be directed to the corresponding author.