Figures & data
Figure 1 Timeline and methodology. (A) Timeline for treatment and assessment. (B–C) Functional respiratory imaging derived regional ventilation map showing (B) homogeneous ventilation in a healthy subject, and (C) ventilation heterogeneity in a subject with severe asthma. (D) Schematic representation of expected changes in the ventilation histogram before (solid line) and after (dotted line) BT. The diagram illustrates a reduction in spread or standard deviation in the post-BT histogram, signifying a reduction in ventilation heterogeneity after BT.

Table 1 Patient Characteristics
Table 2 Key Clinical Outcomes Pre and Post BT
Table 3 Lung Function Pre and Post BT
Table 4 Kurtosis, Skewness and CT-Derived Ventilation Values at V1, V2 and V3
Figure 2 IQD values reported at the lung level across various timepoints. Bars and error bars represent mean and standard deviation. Open circle represents individual data-points. (A) Mean IQD significantly decreased after treatment of the left lung, with treatment effect persisting up to 12 months after BT. (B) There was a trend towards a significant decrease in IQD after treatment of the right lung, with no other significant changes noted across timepoints.
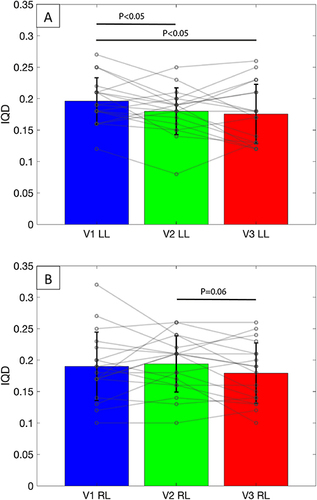
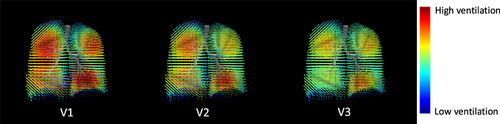
Figure 3 Graphical illustration of ventilation maps at various timepoints from a representative patient. A decrease in ventilation heterogeneity is apparent visually by more regions nearing average ventilation (green and yellow), rather than interspersed regions of high (red) and low (blue) ventilation. Note the improvement in ventilation heterogeneity of the left lung between V2 and V1, and of the right lung between V3 and V2. V1, baseline; V2, 4-week post treatment of left lung; V3, 12-month post treatment of right lung.